
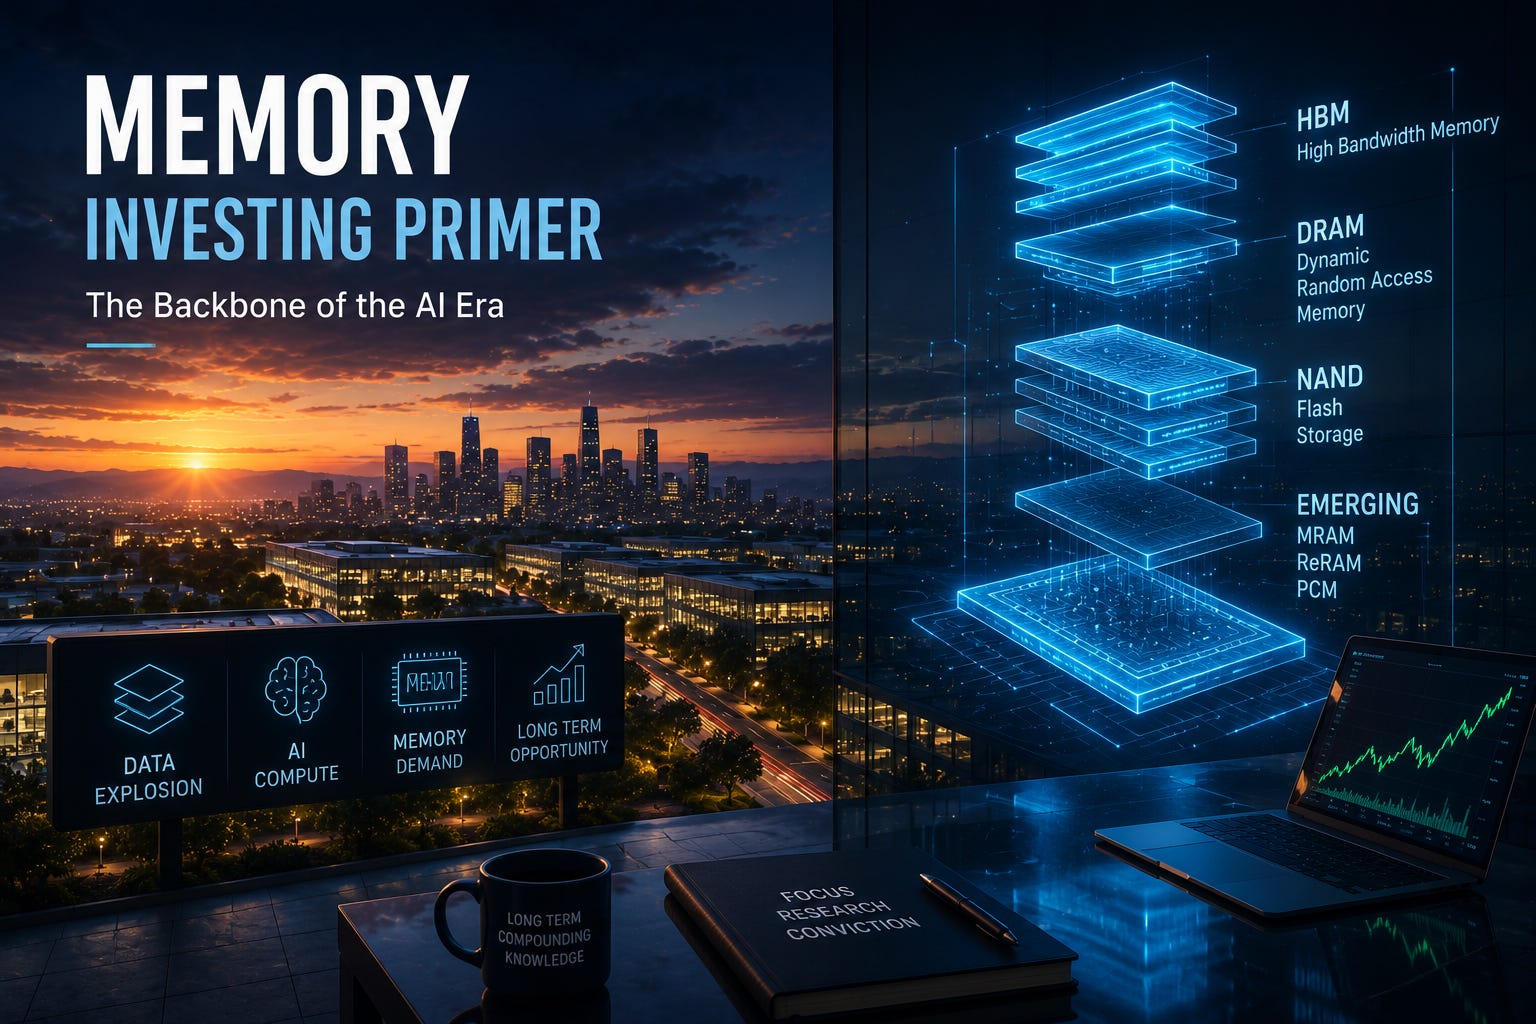
Memory Chips: An Investor Primer
Live Snapshot (as of 2026-07-22/23)
Micron (MU): $959, market cap ~$1.08T, trailing P/E ~22, P/B 10.75
SK Hynix (000660.KS / SKHY Nasdaq ADR): ₩1.78M / ~$165 (ADR), market cap ~$854 to 903B, trailing P/E ~17, P/B ~8.0
Samsung (005930.KS / SSNLF): ₩268.5K, market cap ~$1.12T, trailing P/E ~21, P/B n/a
Kioxia (285A.T): ¥64.7K, market cap ~$205 to 216B (down 52% from its late-June peak, extremely volatile), trailing P/E ~64, P/B n/a
SanDisk (SNDK): $1,599, market cap ~$237B, trailing P/E ~54, P/B n/a
Context, not memory names: Nvidia (NVDA) ~$5.1T market cap, Broadcom (AVGO) ~$1.9T market cap
1. The Map: Memory Types at a Glance
DRAM: Volatile working memory (DDR5 servers/PCs, LPDDR5X mobile, GDDR7 graphics). AI relevance is indirect but big: HBM eats DRAM wafers, which tightens commodity DRAM and pushes prices up. This is the core of the Big-3 thesis.
HBM: Stacked DRAM dies wired by through-silicon vias (TSVs), sitting next to the GPU. This is the AI story, full stop, every Nvidia H100/B200/GB200, AMD MI300X/MI350X, and Google TPU uses it. Highest-margin, fastest-growing memory line.
NAND: Non-volatile 3D storage (SSDs). Real second-order AI demand exists here too: HDD lead times now run over 52 weeks, pushing cloud providers toward QLC SSDs (TrendForce, Sep 2025). Structurally lower-margin than DRAM (see section 3).
NOR: Byte-addressable code storage. No meaningful AI relevance. A durable niche in auto/industrial: Macronix, Winbond, Infineon.
Emerging (MRAM, ReRAM, FeRAM, CXL): Mostly optionality. Small and speculative (see section 6).
Kill list: PCM / 3D XPoint / Optane is dead (Intel and Micron shut it down 2021 to 2022). And note CXL is not a memory cell, it’s an interconnect protocol over PCIe for attaching extra DRAM. Standards are mature; hyperscaler deployment is still early.
HBM in two paragraphs (the part worth actually understanding)
A good analogy I like to use to better understand the difference between DRAM and HBM, is comparing things we see in our everyday lives. DRAM transfers information very similar to a city-road, multiple lanes traveling the distances to send information back and forth from the CPU. HBM, on the other hand, is like stacking a block of apartments on top of each other, and using high-speed elevators rather than city roads. This means the data will not travel far, but in the small space it can travel, it travels instantly, like an elevator would.

HBM stacks 8, 12, or 16 DRAM dies vertically (TSVs through the silicon), on a base logic die, on a silicon interposer beside the GPU (TSMC CoWoS). The trick is width, not clock speed: a 4-stack HBM setup gives a 4096-bit bus versus GDDR’s 512-bit. The JEDEC generations run HBM3 (Jan 2022, 819 GB/s), then HBM3E (up to 48GB 16-Hi, ~1.2 TB/s), then HBM4 (spec finalized Apr 2025: 2048-bit interface, doubled, 2.0 TB/s floor; vendors claim top bins of 2.8 to 3.3 TB/s, treat as a range). GDDR7 (JEDEC Mar 2024, 32 to 48 Gbps/pin) is the cheaper-per-GB alternative, and Nvidia’s inference-focused CPX GPU uses GDDR7, not HBM. HBM is not for everything.
2. Real-World Pricing Numbers
Standard DRAM, DDR5:
A standard kit of two 16GB sticks (32GB Kit) of decently rated desktop RAM on the long run will generally cost anywhere from $180 all the way up to $250 USD. Prices of RAM often shift so expect RAM prices to be on the higher side due to the state of the memory market.
HBM (High Bandwidth Memory):
Contract / Enterprise Pricing: HBM is sold exclusively in multi-layer stacks (usually 24GB or 36GB cubes) directly to GPU makers like NVIDIA and AMD.
A 24GB HBM3e stack costs approximately $300 – $400 USD ($12.50 – $16.00+ per GB), making it more than an astonishing double to triple the cost per gigabyte of standard DRAM.
When integrated into an AI chip, such as the NVIDIA Blackwell GPU which carries 193GB of HBM3e, the memory alone accounts for thousands of dollars of the chip’s total price tag.
NAND Flash (Storage):
Consumer SSDs (PCIe 4.0): 1TB M.2 SSDs can run anywhere from $110 to $160 USD, just over 10 cents a GB.
Enterprise SSDs, which tend to be higher in density, can run around 20 cents on the GB.
3. Manufacturers: Who Makes What
Samsung (005930.KS / OTC: SSNLF): Makes DRAM, HBM, and NAND. #1 in DRAM and NAND, and the only fully integrated player (memory plus foundry plus logic).
SK Hynix (000660.KS Seoul, plus SKHY Nasdaq ADR since Jul 10 2026): Makes DRAM, HBM, and NAND (via Solidigm). The HBM leader, and Nvidia’s #1 supplier.
Micron (MU, US): Makes DRAM, HBM, and NAND. The only US pure-play, and a CHIPS Act beneficiary.
Kioxia (285A.T, IPO’d Dec 2024): NAND only. Invented NAND (Toshiba, 1987). Bain holds 51%.
SanDisk (SNDK, spun from WD, Feb 2025): NAND only. The cleanest US-listed NAND pure play, with a Flash Ventures JV with Kioxia.
CXMT (private, China; pursuing a ~$4.2B Shanghai IPO): Makes DRAM (DDR4/DDR5 legacy). China’s commodity-DRAM entrant.
YMTC (private, China, state-backed): NAND. Roughly 12% NAND share, sitting outside the official top-5 tables.
4. Market Share (date and source on every figure)
Flag: the percentages below are the last quarter TrendForce published to press. A newer 2Q26 table could not be sourced this pass. Treat the split as directionally stable, not this-second precise.
DRAM, 1Q26, TrendForce: - Samsung: 38.5% - SK Hynix: 28.8% - Micron: 22.4% - CXMT: roughly 6 to 10% of output (not revenue-equivalent) - Nanya: 1.9% - Winbond: 0.6%
Big 3 combined is roughly 90%. Notable: SK Hynix was briefly #1 by revenue in 1Q25 (first time in 33 years) and beat Samsung in FY2025 operating profit (first time ever) on its HBM-heavy mix.
HBM, mid-2026, mixed analyst sources (ranges; the volume split remains open): - SK Hynix: ~50 to 65% (durable leader) - Samsung: ~25 to 30% (recovered from a ~17% low in Q2’25 after its Nvidia-qualification lag) - Micron: ~15 to 22% (up from roughly 0 in 2024)
Nvidia qualified all three for Vera Rubin HBM4 (June 2026), so the Samsung-qualification saga is resolved. But qualification does not equal volume: who wins the HBM4 volume allocation is still an open question (could not be pinned to a hard split this pass).
NAND, Q4’25, TrendForce (sources noisy): - Samsung: ~28% - SK Group (Hynix plus Solidigm): ~22% - Kioxia: ~15.6% - Micron: ~14% (some sources say ~12%) - SanDisk: ~14% (some sources say ~13%) - YMTC: ~12% (outside the TrendForce top-5)
The structural point: NAND never consolidated like DRAM. Five-plus players, plus state-backed YMTC, means NAND margins run structurally below DRAM/HBM. DRAM is an oligopoly; NAND is a knife fight. (Chinese suppliers are also rising toward ~19% of global NAND bit output, the eventual rebalancing driver, see section 7.)
The two numbers that explain the whole HBM thesis
HBM is ~30% and rising toward ~50% of DRAM revenue but only ~8 to 13% of bits (end-2025: ~18% of wafer input, ~8% of bits). Disproportionate dollars per wafer is the whole point.
Sourced supply mechanism: wafer displacement, roughly a 3:1 HBM-to-DDR5 wafer-conversion ratio (Micron). The popular “TSV yield / CoWoS packaging is the real bottleneck” framing could not be confirmed here, treat it as an open question.
5. Strengths and Weaknesses
SK Hynix - Strength: HBM leader, first 12-layer HBM3E (Sep 2024), HBM4 development complete, and 1Q26 operating margin of 72%, above Micron’s 67.6% and TSMC’s 58% (verified) - Weakness: Smallest of the Big-3 by total DRAM revenue, heavy Nvidia/AI concentration, enormous capex commitments
Samsung - Strength: #1 in DRAM and NAND, deepest balance sheet, only vertically integrated player, HBM catch-up resolved (HBM4 mass production Feb 2026), and DS division operating profit ~$36B in 1Q26, up ~49x year over year (verified) - Weakness: Lost roughly 2 years of Nvidia HBM leadership, foundry division a persistent drag, and ~40% of NAND comes from Xi’an, China (geopolitical exposure)
Micron - Strength: Only US pure-play (CHIPS Act, the default non-Korea/non-China supplier), HBM sold out through 2026 with over $100B in signed contracts, hit a $1T market cap on May 26 2026 (verified), and Q3 FY26 (ended May 28) revenue of $41.5B / EPS $24.67, a record quarter, larger than all of FY25 ($37.4B), with revenue near-doubling three quarters running: $13.6B, then $23.9B, then $41.5B (verified) - Weakness: Smallest of the three, still building HBM credibility, highest capex intensity relative to its balance sheet
Kioxia - Strength: NAND heritage plus Flash Ventures JV scale (shared Japan fabs with SanDisk), BiCS10 at 332 layers - Weakness: 100% NAND-cycle exposure with no DRAM to smooth earnings, Bain’s 51% PE overhang, thin float, and whipsaw volatile (down 52% from its late-June peak) (verified)
SanDisk - Strength: Clean US NAND vehicle, and the JV survives the WD split - Weakness: Same all-NAND cyclicality as Kioxia
CXMT - Strength: Real competitiveness at commodity/legacy DDR4-DDR5, targeting an HBM back-end by end-2026 - Weakness: Not competitive at the leading edge/HBM yet, and on the US Entity List: interagency-approved in 2025 but still not published or delayed as of mid-2026, the key China swing variable (verified)
Full-year 2026 profit figures, labeled honestly: the big numbers circulating (Samsung ~$200 to 257B, SK Hynix ~$40 to 56B+) are analyst projections, not company guidance (verified). Anchored reality: SK Hynix’s reported Q1’26 operating profit was ₩37.6T (~$27B) at that 72% margin; Samsung’s DS division came in around $36B. SK Hynix reports Q2 on July 23, so these will move.
NAND layer counts, the most volatile spec in the space: Samsung is at 400+ in production with a 900-layer R&D demo in May 2026; SK Hynix is at 321; Kioxia and SanDisk are at 332. TLC means 3 bits/cell (mainstream); QLC means 4 bits/cell, roughly 20 to 30% cheaper per TB, and is the AI bulk-storage workhorse.
6. Biggest Customers
HBM: Nvidia is dominant (~60%+ of demand), and SK Hynix’s relationship with Nvidia is the axis of the whole trade. AMD is second. Hyperscaler ASICs (Google TPU, AWS Trainium, Microsoft Maia) are real demand too, but note Broadcom and Marvell are ASIC design partners, not HBM buyers, they integrate the Big-3’s HBM on hyperscalers’ behalf.
DRAM: Hyperscalers (servers), phone OEMs (Apple, Samsung mobile, Chinese OEMs), and PC makers.
NAND/SSD: Hyperscalers (datacenter eSSD, the surging segment), enterprise, Apple, and client PCs/phones.
Concentration cuts both ways: multi-year contracts give revenue visibility, but the highest-margin product line hangs substantially on one customer, Nvidia.
7. How to Invest
MU, Micron (pure-play memory): Cleanest US access to the whole thesis.
SKHY / 000660.KS, SK Hynix (pure-play): Biggest HBM beneficiary, now directly buyable in the US via the SKHY Nasdaq ADR (since Jul 10 2026; 10 ADR = 1 share), no more Seoul-only friction.
005930.KS / SSNLF, Samsung (diversified): Memory exposure diluted by foundry, mobile, and display businesses.
285A.T, Kioxia (NAND pure play): NAND-cycle leverage, but thin float, a PE overhang, and high volatility.
SNDK, SanDisk (NAND pure play): US-listed NAND-only vehicle.
LRCX, Lam Research (equipment): TSV etch, direct HBM/3D-NAND leverage.
AMAT, Applied Materials (equipment): Broad deposition/etch exposure.
KLAC, KLA (equipment): Multi-die stack inspection/yield, more critical as stacks rise.
6857.T, Advantest (equipment): HBM test, dominant share, one of the most direct HBM picks-and-shovels plays.
ASML (equipment): Weak HBM-specific link, HBM runs on mature DRAM nodes, not EUV. Don’t buy it for this thesis.
ALAB, Astera Labs (adjacent): CXL/PCIe interconnect and memory pooling, an AI-infra beneficiary, not an “HBM controller.”
MRVL / AVGO, Marvell / Broadcom (adjacent): ASIC integrators, so indirect HBM demand pull-through.
MRAM, Everspin (emerging): The only discrete-MRAM pure play, small, an aerospace/auto niche.
WBT.AX, Weebit Nano (emerging): ReRAM IP licensing (TI license, tape-outs), early and speculative.
688008.SS / 6809.HK, Montage (adjacent): Memory-interface chips, with China exposure.
SOXX / SMH, ETFs (broad semis): Memory is a minority slice, and no pure-memory ETF exists.
Emerging-tech reality ranking: NOR/FeRAM (established niches) beats MRAM (real, small) beats ReRAM (early licensing) beats CXL (protocol, deployment early) beats PCM (dead).
8. The Cycle and Risk Framework (the judgment section)
Why memory is brutally cyclical: commodity product, plus oligopoly, plus lumpy multi-year fab additions, plus inelastic short-run demand, equals boom/bust. Recent history: the 2017 to 2018 boom (DRAM prices roughly tripled), then the 2018 to 2019 bust, then the 2022 to 2023 trough (Samsung’s chip profit down over 90%), then the 2024 to 2026 AI recovery.
Where we are (verified 2026-07): - Server DRAM contract prices up 13 to 18% quarter over quarter into Q3’26 (verified, TrendForce, 7/9/26), and TrendForce now guides DRAM tightness into 2027 too (RDIMM bit-supply growth only +15 to 20% year over year versus faster server-CPU growth). No 2027 DRAM glut signal. - NAND: roughly 4 to 5% undersupply in 2026, with relief only in 2H27 (verified, TrendForce, 7/21/26), not “2027” broadly. SLC NAND is up 120 to 170% in 2H26. - 2026 HBM/DRAM/NAND capacity is described as “sold out” by both Micron and SK Hynix. - The glut-risk vector is specifically Chinese suppliers (CXMT/YMTC) rising toward ~19% of global NAND bit output, and that’s what eventually rebalances NAND in 2H27.
The supercycle debate, live and unresolved (hold both sides):
Bull case: 3 to 5 year contracts dampen volatility, HBM demand is committed multi-year, and there’s talk of a “supercycle through 2028.” Long-term agreements (LTAs) make up roughly half of SK Hynix’s revenue.
Bear case: all three makers are expanding into the same demand signal, a classic synchronized-overinvestment glut setup, and “every memory cycle ends the same.” Also, LTAs dampen HBM’s cyclicality specifically, NOT the commodity DRAM/NAND majority of the business.
A margin reality check: HBM briefly lost its margin premium to DDR5 64GB RDIMMs in Q1 2026, because its annual contract pricing lagged a DDR5 spot spike (TrendForce). “HBM equals permanent fat margins” is a structural tailwind with real quarterly wobble, not a law.
The valuation trap (the most important paragraph in this document): memory stocks look cheapest on P/E exactly at the earnings peak, because cycle-high prices inflate the E. Concretely: Micron’s P/B has re-rated from its historical 1.3 to 2.5 range to 10.75, 4 to 8 times normal. Its trailing P/E of ~22 “looks cheap” only because annualizing the peak quarter ($24.67 EPS times 4, about $99) implies a ~9.7x run-rate, meaning it’s cheap only if you extrapolate record DRAM/HBM pricing forever. SK Hynix’s ~8x P/B on a 72% operating margin that exceeds TSMC’s is itself the peak-of-cycle tell. Normalize on P/B versus history and mid-cycle earnings, never on a single peak-year multiple.
Other risks, ranked: 1. Cycle timing, the valuation trap above 2. Customer concentration, Nvidia via HBM 3. China, CXMT/YMTC ramping at the commodity end (NAND toward ~19% of bits), with export-control policy (the CXMT Entity List still unresolved) as the swing factor 4. Capex intensity, record profits get recycled into record spending 5. FX and access, the KRW/JPY overlay on the Korea/Japan names (though SK Hynix’s SKHY ADR now removes that friction for the one name) 6. The share-confusion trap, Samsung leads total DRAM, SK Hynix leads HBM. Don’t conflate them.
Before You Act: Verification Checklist (status as of this pass)
Live valuations pulled, done. See the Live Snapshot above; the “$41.5B Micron quarter” and “$205B Kioxia cap” both verified as real, not errors.
Latest TrendForce quarterly share tables, NOT done. Could not re-source a newer quarter this pass; DRAM 1Q26 / NAND Q4’25 shares stay as the last-published, directionally stable figures.
HBM4 volume allocation (Vera Rubin), NOT done, still open. Qualification is done (Jun 2026), but that does not equal volume share, no hard split available yet.
CXMT Entity List, done. Still interagency-approved-but-unpublished/delayed as of mid-2026 (last dated source Jun 17 2026), remains the key China swing variable.
SK Hynix US access, done, resolved. SKHY trades on Nasdaq since Jul 10 2026 (10 ADR = 1 share).
Valuation on P/B vs history, done. MU P/B is 10.75 versus its 1.3 to 2.5 norm; peak-quarter-annualized run-rate P/E is ~9.7x, the cycle trap, quantified.
2027 supply, done. NAND relief pushed to 2H27 (2026 deficit ~4 to 5%); DRAM tightness now guided into 2027; watch Chinese NAND (~19% of bits) as the rebalancing vector.
Compiled 2026-07-22; dollar figures, listings, and status items verified against live sources 2026-07-22/23. Two items could not be re-verified this pass and stay explicitly flagged: the exact quarterly market-share percentages and the HBM4 volume split. Everything else is current as dated. Memory is violently cyclical, all prices/caps move daily, re-pull before acting.
Educational primer, not financial advice. For informational purposes only. Do your own research.


