


October’s second half was positive in five of six midterm years for both SPX and QQQ. The first half was positive in just three.
I extended the September seasonality study through October, using the same years: 2002, 2006, 2010, 2014, 2018 and 2022.
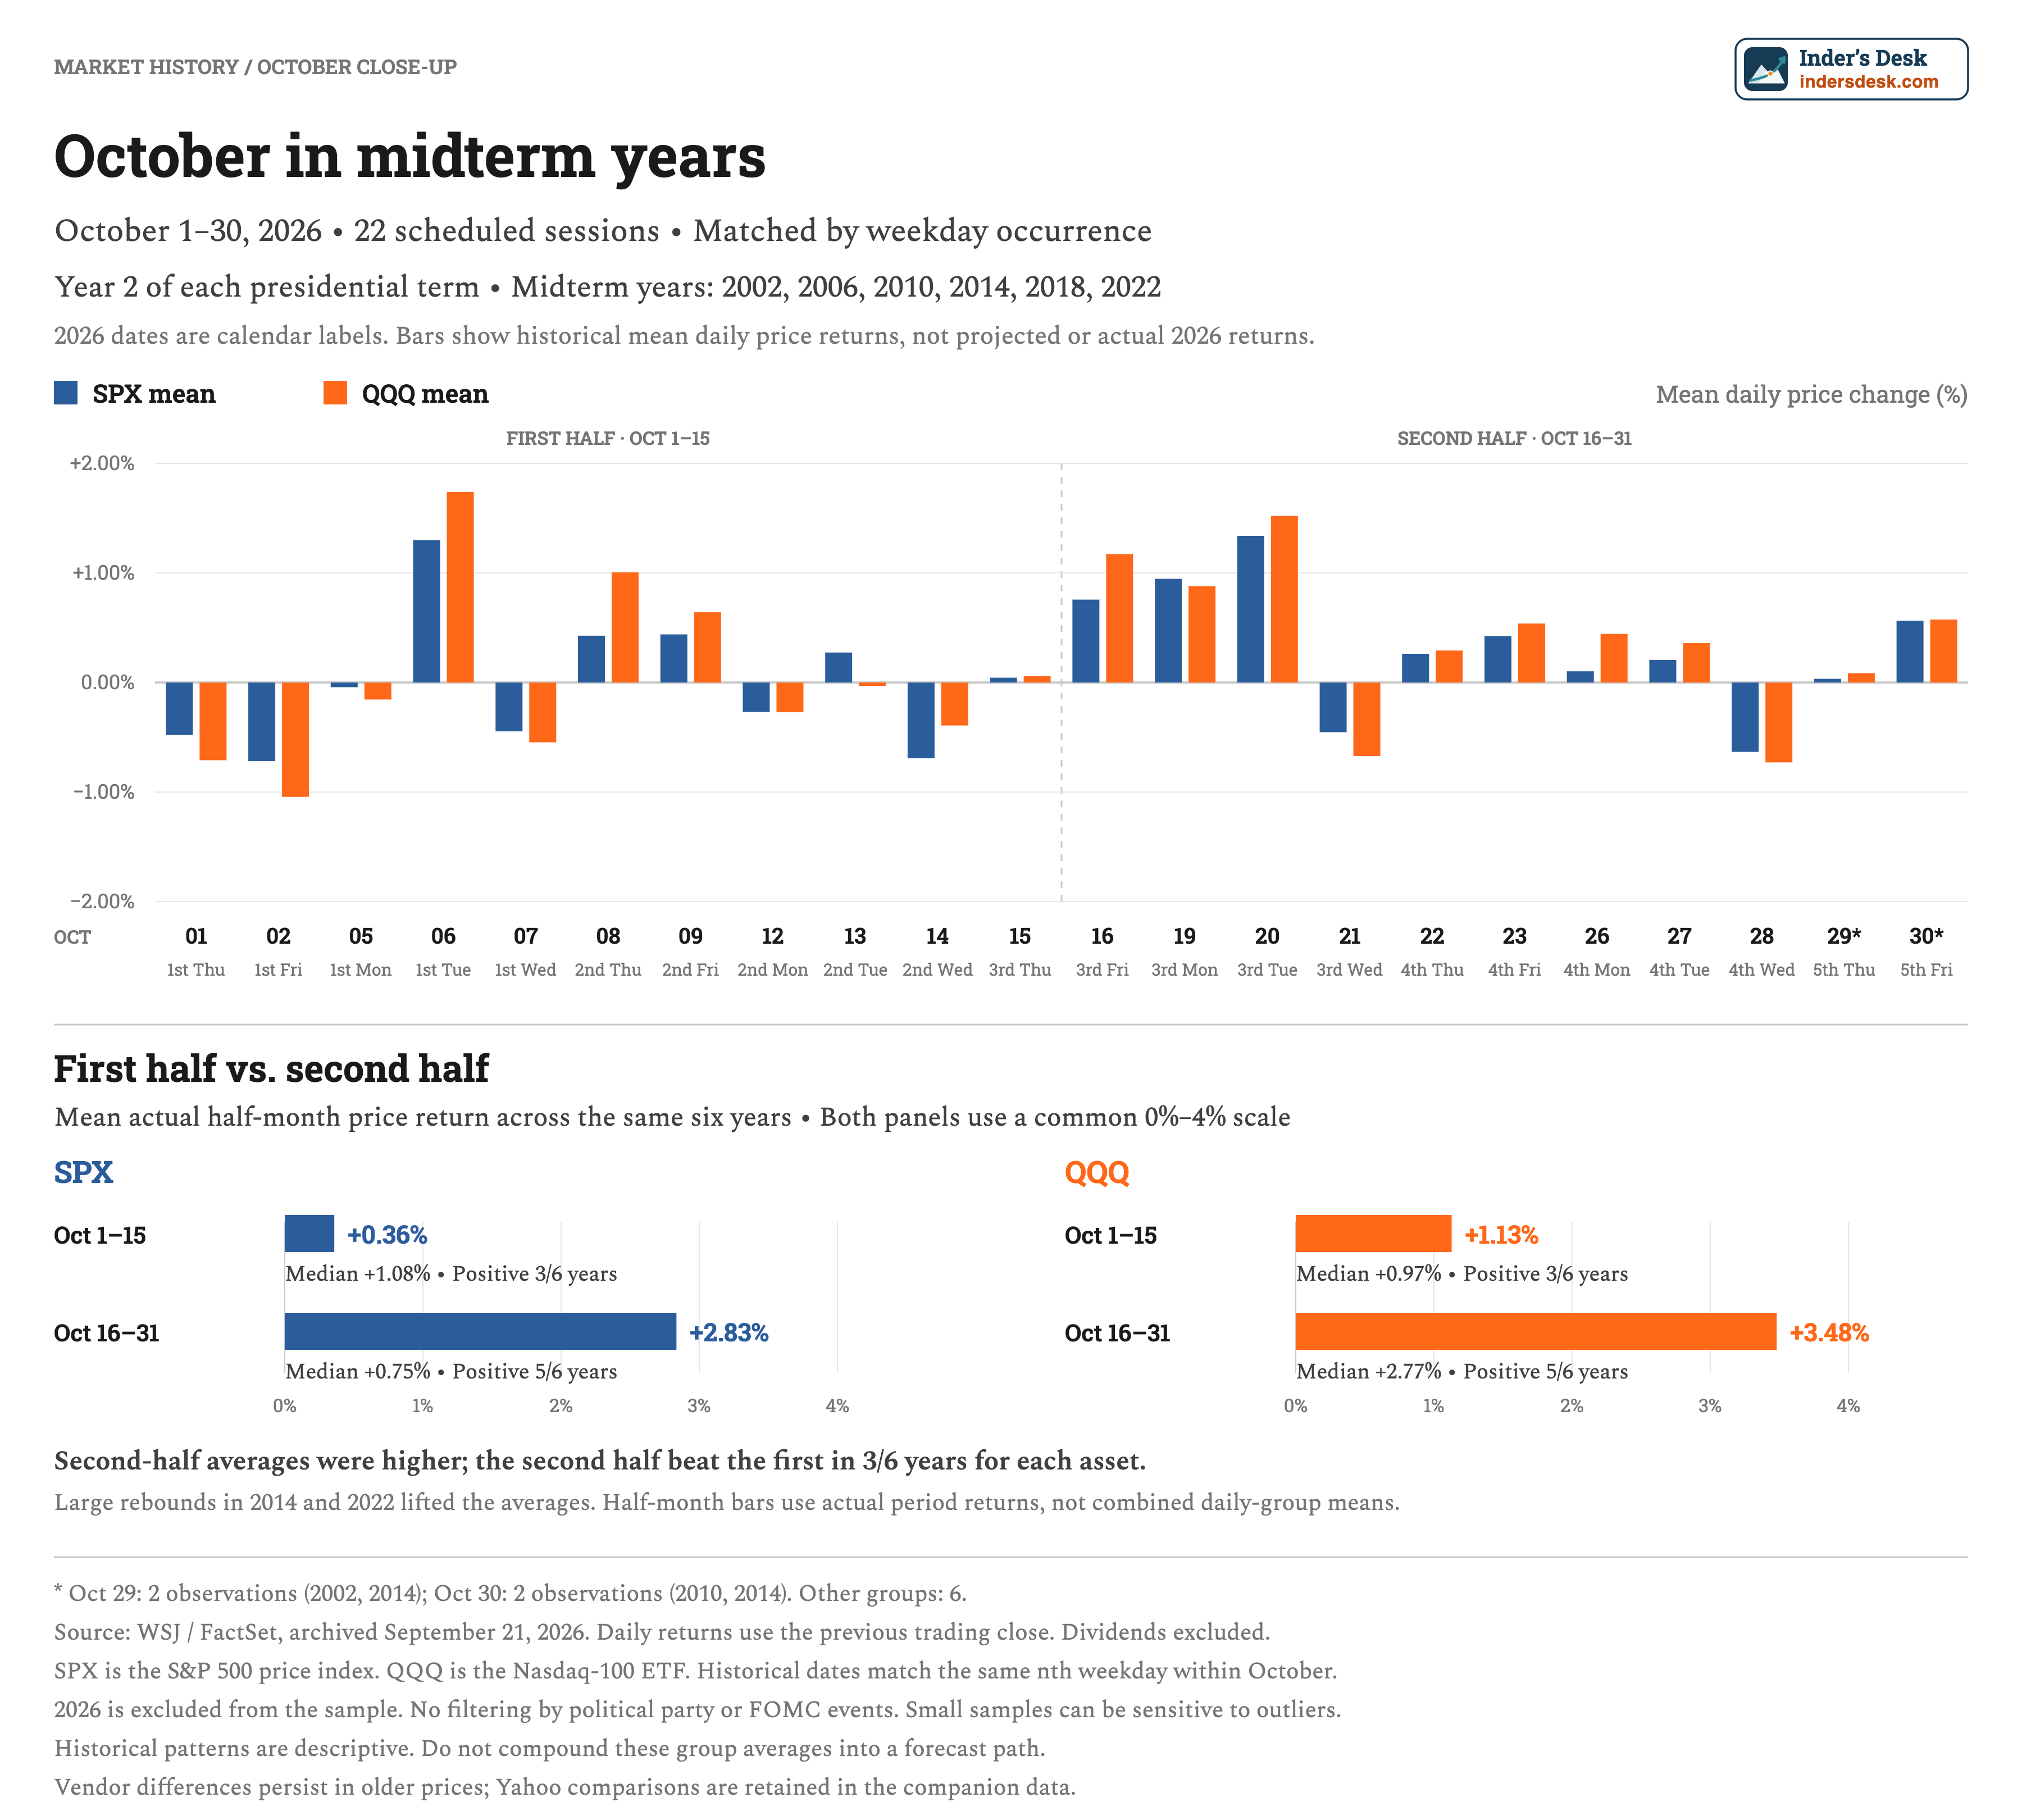
The difference in average returns is clear:
SPX: +0.36% in October 1–15 versus +2.83% in October 16–31.
QQQ: +1.13% in October 1–15 versus +3.48% in October 16–31.
The catch: The second half beat the first within the same year only three times out of six. Large rebounds in 2014 and 2022 lifted the averages. SPX’s median return was actually slightly lower after midmonth.
The daily chart also shows an uneven pattern. The groups mapped to October 16, 19 and 20 had positive averages for both assets; October 21 and 28 had negative averages.
My takeaway: The second half has the more favorable historical record in this sample. I’d give that tendency more weight if market participation improves and rallies hold their gains. The calendar alone is a weak reason to buy.
The daily detail
Mean and median daily returns, plus the share of positive sessions. Click the table to enlarge.
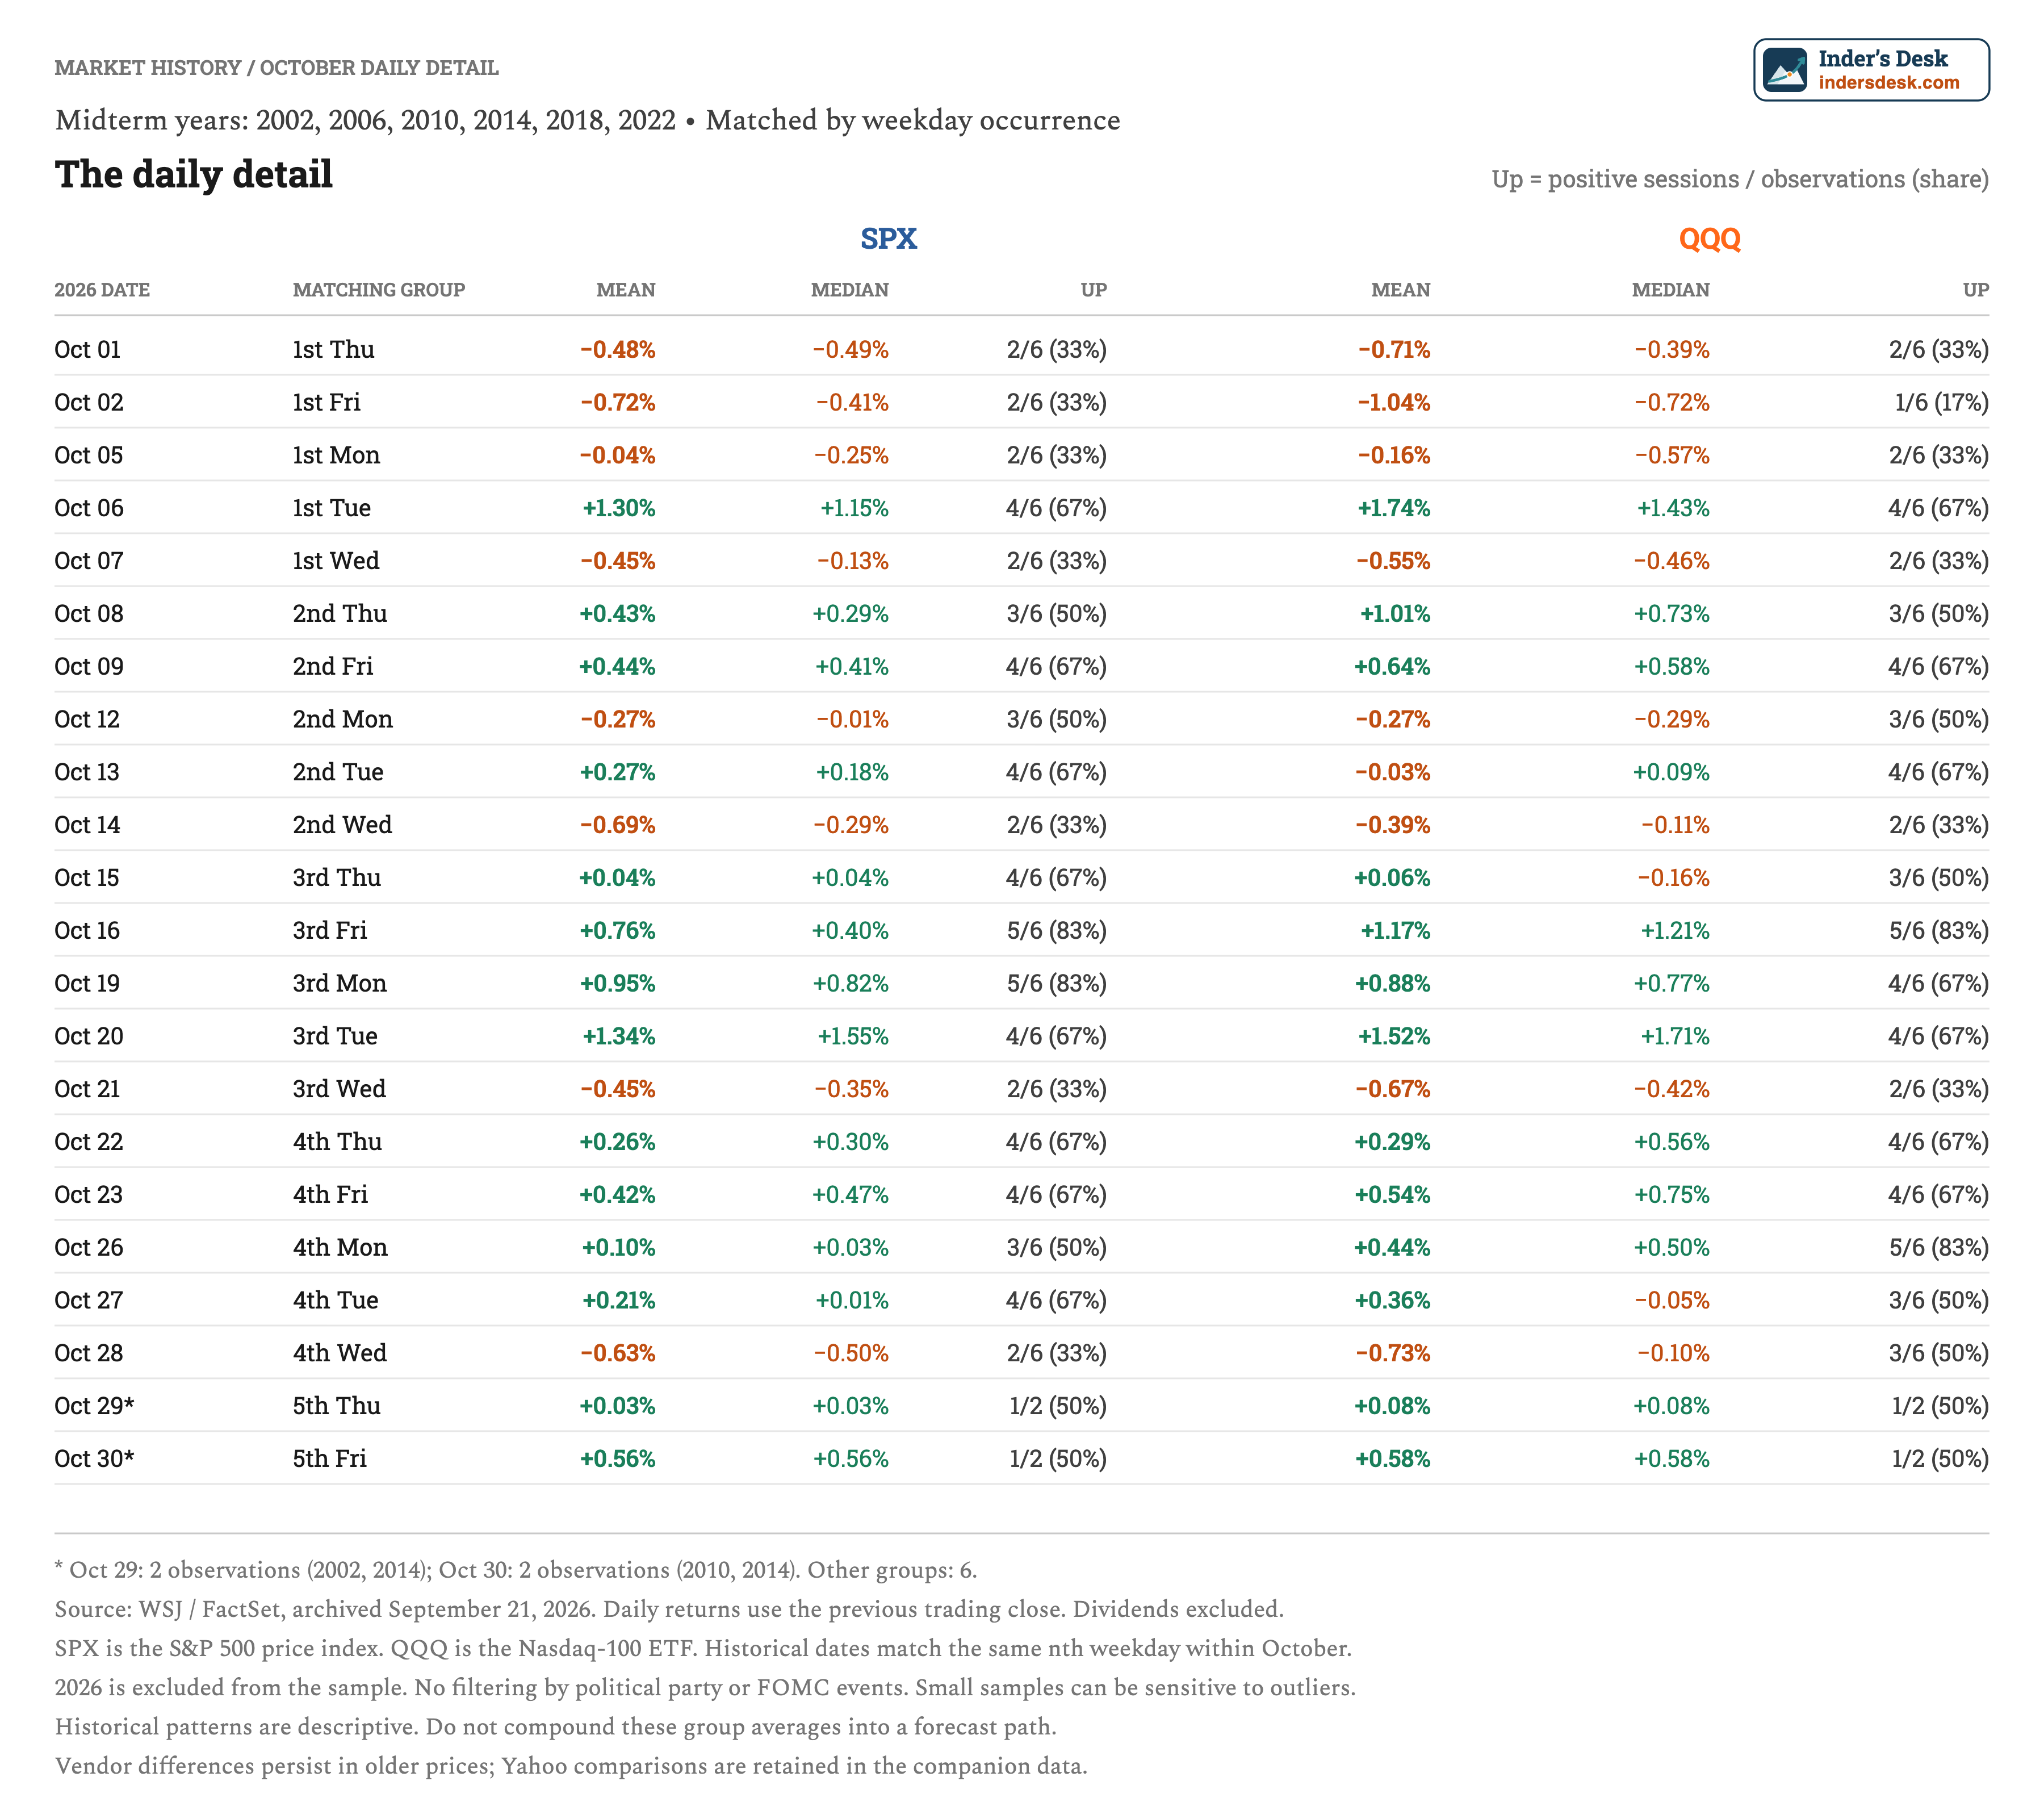
Source: Archived WSJ / FactSet prices; dividends excluded. Half-month returns use actual historical closing prices, split at the last trading close on or before October 15. Daily bars match weekday occurrences to the 2026 calendar; they are not forecasts. The final two daily groups have only two observations each.
Disclaimer:
This article is for informational and educational purposes only and does not constitute financial, investment, tax, or legal advice. Any opinions, scenarios, price targets, or market observations reflect my personal views and may change without notice. Investing and trading involve substantial risk, including the possible loss of principal. You are solely responsible for your own investment decisions, position sizing, risk management, and trades. Conduct your own research and consult a qualified professional where appropriate.