



Today I want to walk through how I use the opening range to take a position in a breakout stock. CoreWeave gives me a useful example of the entire process: the support I watched at the open, the strength that followed, and the later warnings that led me to reduce my exposure.
My starting point is simple. I want to see buyers defend the opening range. From there, I decide whether the price action gives me an entry I can manage.
In this episode, I explain:
How I use the first two minutes to define my entry and initial stop.
How I size the position and use VWAP to judge its strength.
Why I decided to reduce my CoreWeave exposure after a second topping warning.
The useful takeaway: I define the risk at the open, then let the developing price action guide how much I keep.
I start with the first two minutes
My preferred opening range is the first two minutes of regular trading, beginning at 9:30 a.m. Eastern. I let that first candle finish and mark its full high and low, including the wicks.
I also keep a five-minute chart open. Five minutes is a valid alternative if that pace feels more comfortable. I choose my range before trading it and wait for it to finish.
For someone learning my approach, I use one straightforward trigger: price breaks above the opening-range high. The low gives me my opening support reference.
In CoreWeave, I watched the low hold
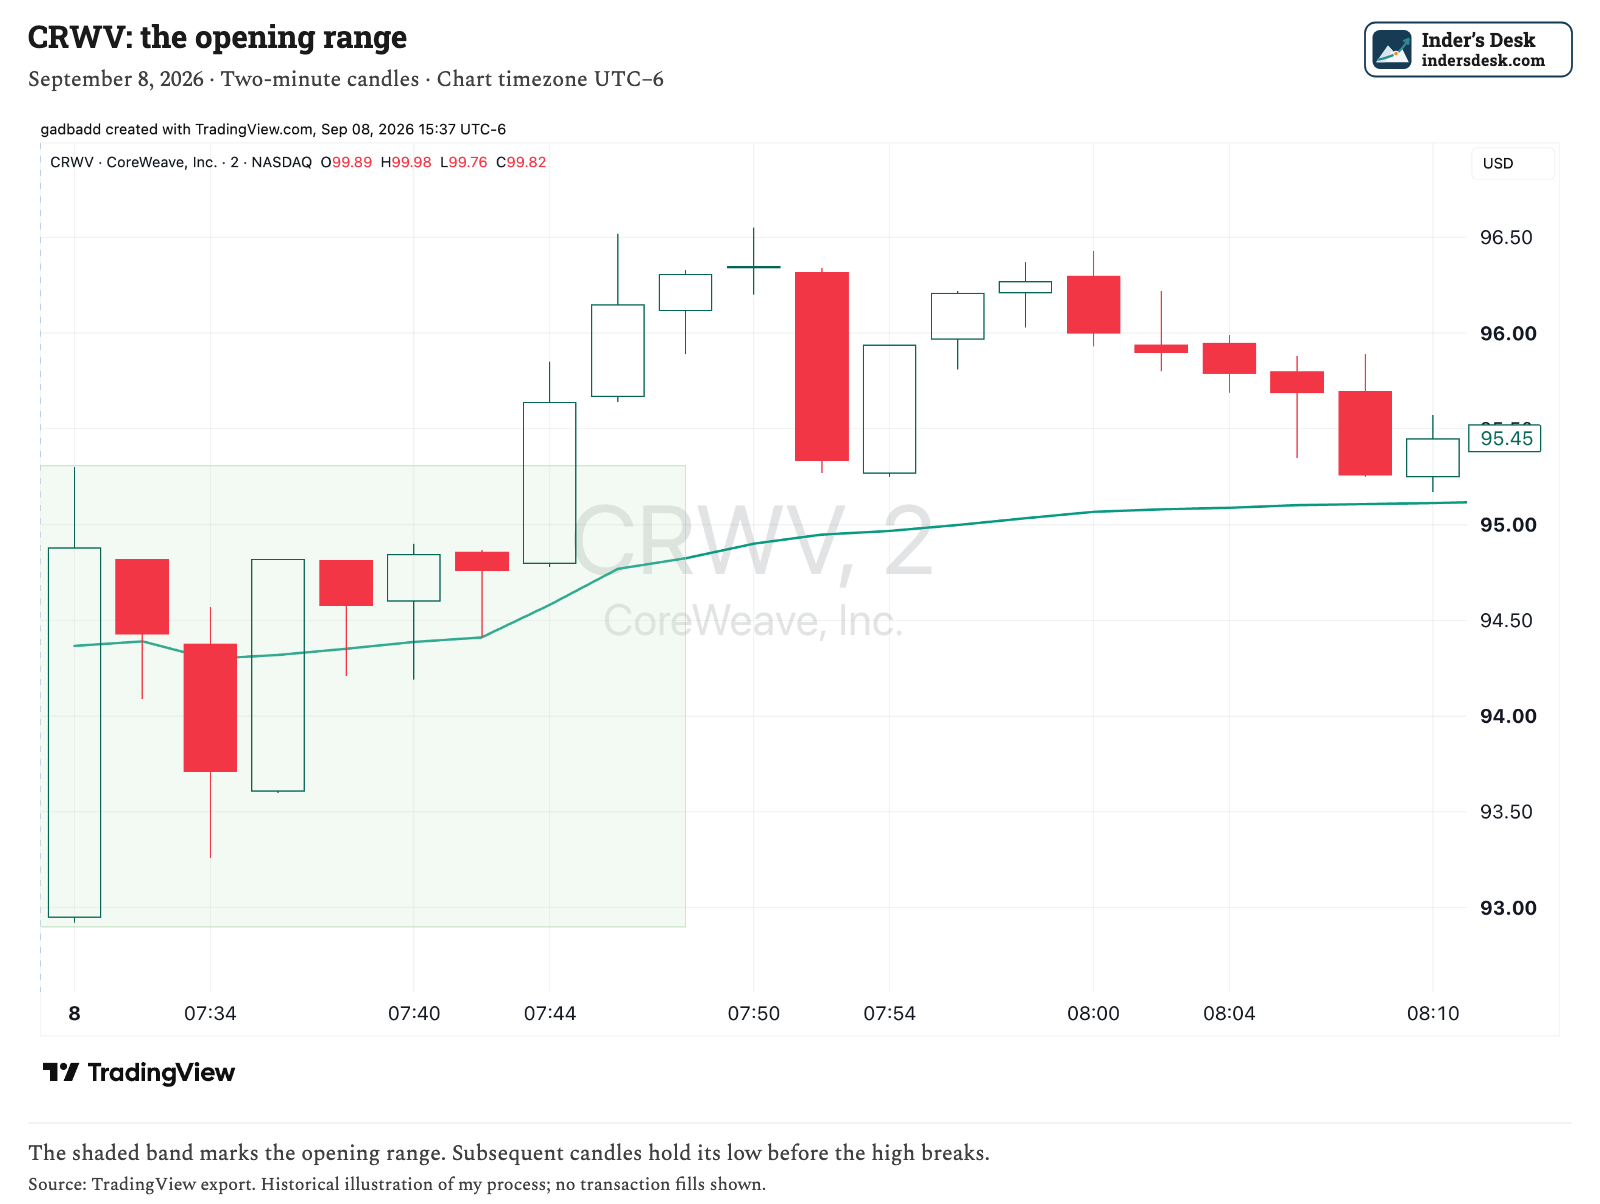
On September 8, the candles after CoreWeave’s first two-minute range kept holding above its low. That was the behavior I wanted to see. Several attempts to move lower were not breaking the opening support. The stock subsequently broke the range high and advanced sharply.
Pro Tip: With experience, I sometimes enter before the high breaks when I see that repeated defense of the low. That is my discretionary read of buyers supporting the price.
The chart does not tell me who those buyers are.
When I explain this to a beginner, I keep the entry simpler: finish the range, mark both boundaries, then wait for the high to break. My earlier discretionary entry is a different choice that comes with a greater chance of acting before a breakout develops.
I anchor VWAP at the regular-session open
VWAP means volume-weighted average price. I use it to judge whether price is maintaining strength relative to trading activity since my chosen starting point.
In TradingView, I open Forecasting and measurement tools → Volume-based → Anchored VWAP, then click the first regular-session bar. For U.S. stocks, I anchor at the 9:30 a.m. Eastern open, checking the chart’s timezone before placing it.
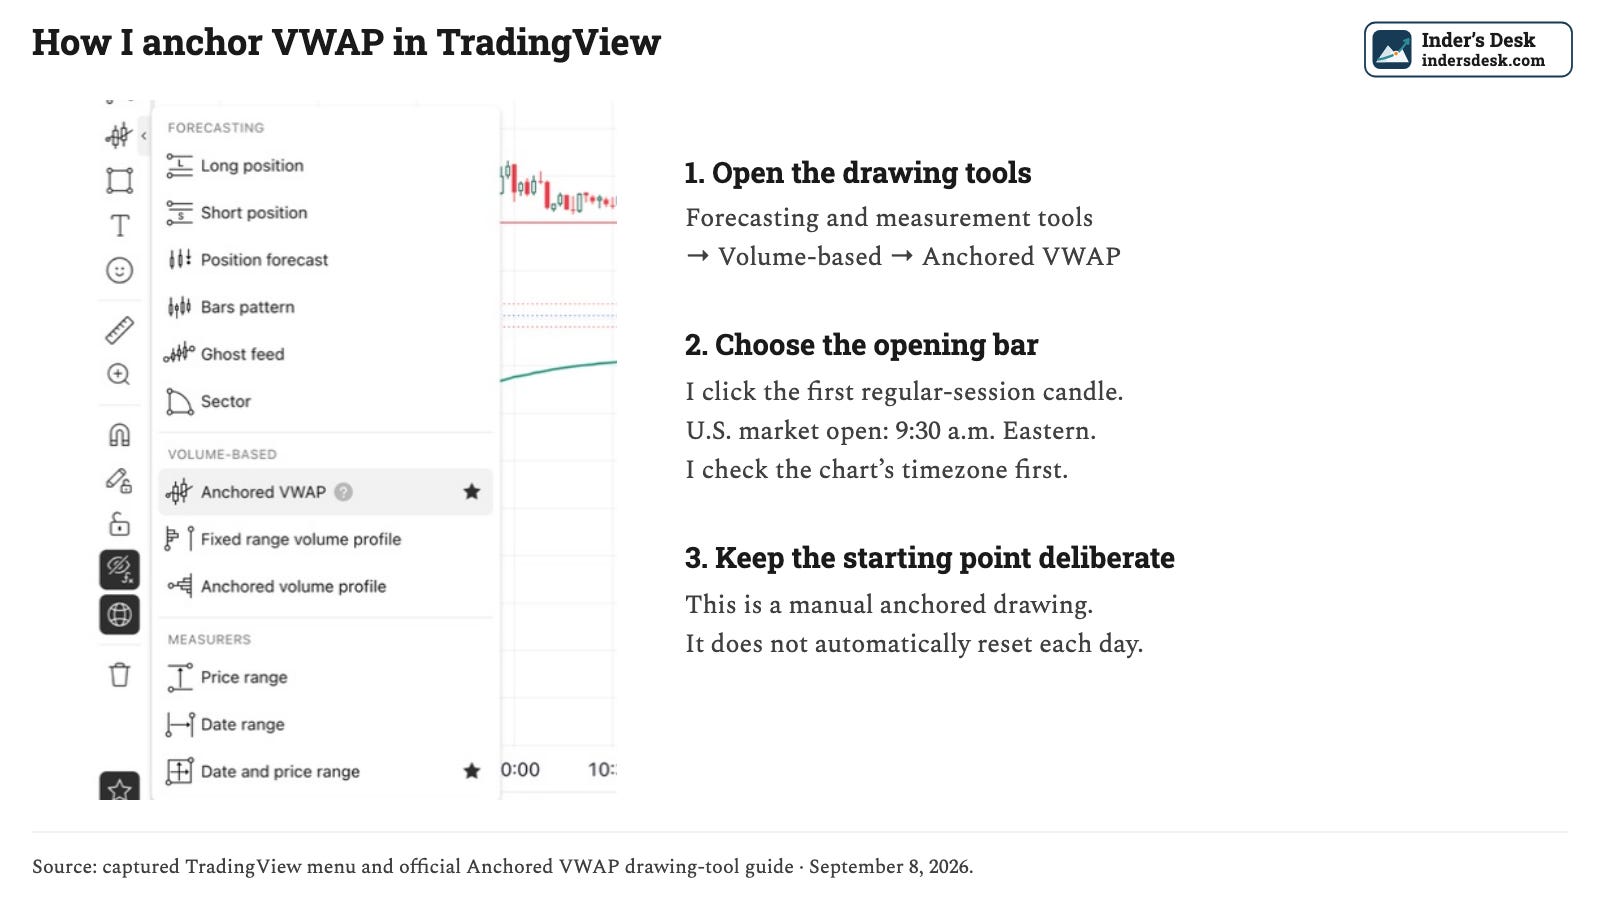
I use the manual Anchored VWAP drawing tool. Its calculation starts where I place it; it does not automatically move to each new session’s open. TradingView documents the tool here.
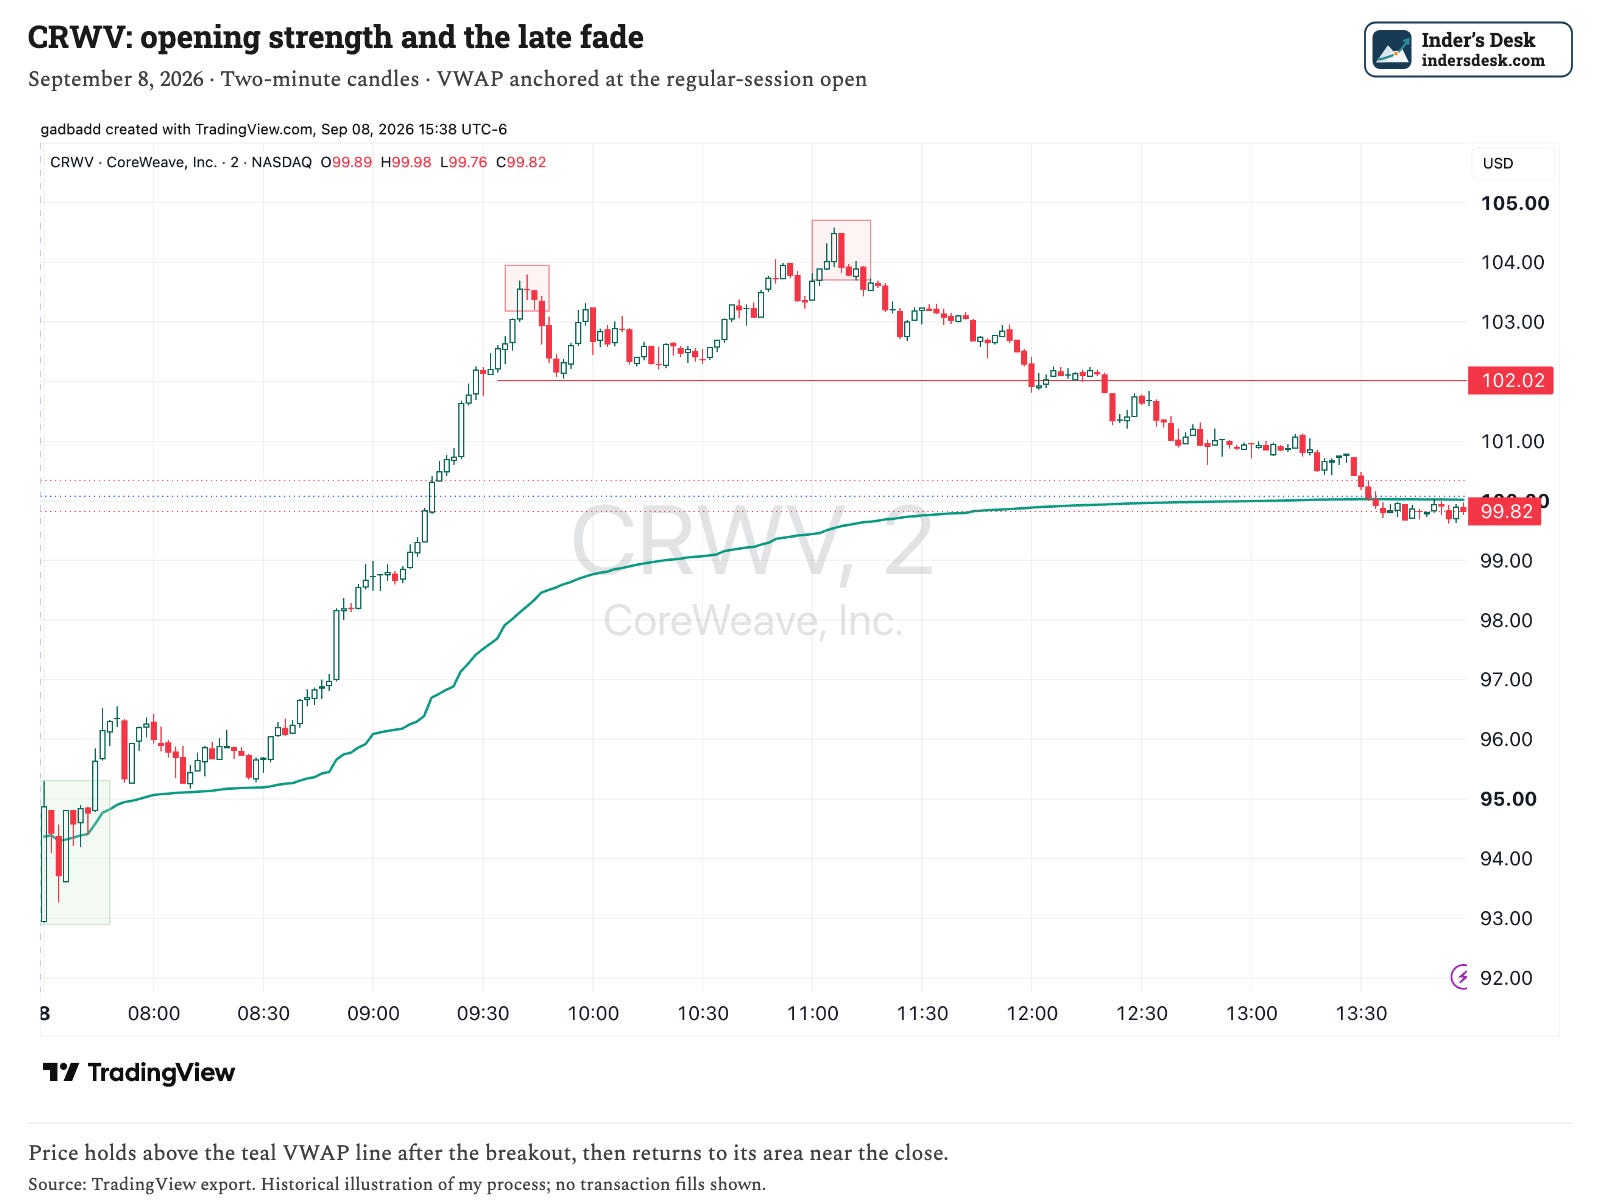
CoreWeave held above that line after its opening breakout, which supported my confidence. Its early candles crossed around VWAP. By the close, price had returned to the session VWAP area, so the morning and closing pictures gave me different information.
I size from the entry to the stop
In this example, my initial stop goes roughly ten cents below the opening-range low. That is the buffer beneath support. My full risk per share is the distance from the entry to that stop. Ten cents is my example here, not a universal setting.
Whole shares = planned dollar risk ÷ (entry − stop), rounded down.
With a hypothetical $3 entry-to-stop distance, a $3,000 risk budget produces 1,000 shares. A $30,000 budget produces 10,000. These examples illustrate the calculation, not suggested beginner risk amounts. I also limit the position to what my capital and buying power can support.
I can plan around the opening high, but I have to account for the actual fill. A higher fill widens the risk to the same stop. A stop order can also execute below its trigger price; the SEC explains that execution risk.
Two warnings changed how much CoreWeave I wanted to keep
After an explosive advance, my usual guideline is to sell about half when the position is roughly 5–10% above my purchase price, then move the remaining stop to entry. I may scale out through several sales rather than act at one rigid percentage. A stop at entry still allows slippage.
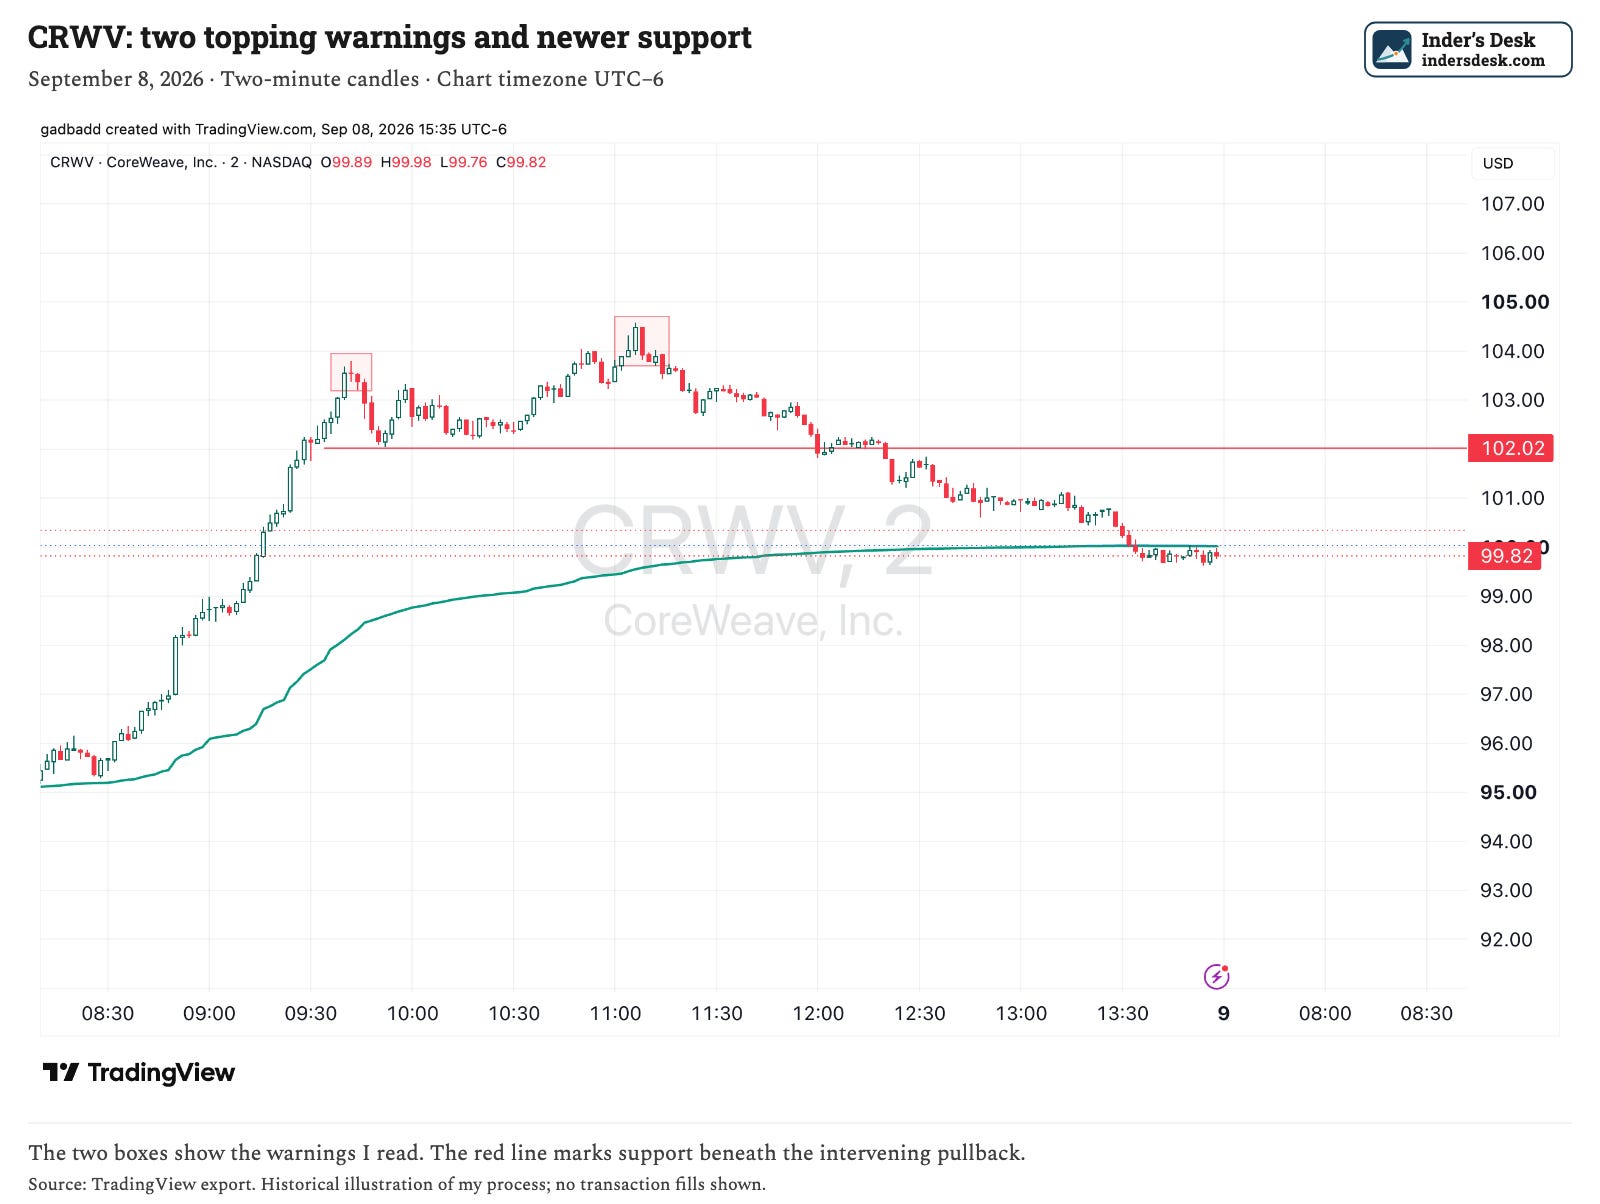
On CoreWeave, I read two later candles as possible topping warnings. I tolerated the first because I had room from my entry and could absorb some volatility. After the second, I started reducing.
This was a 20% position in my account. After the second warning, I decided to reduce it by half. That would bring the exposure roughly toward 10%, before subsequent price moves. This is position allocation, not the percentage of my account at risk, and it explains my concentration decision rather than prescribing a beginner’s size.
I chose a staged reduction: sell one quarter of the original position, then place a stop below the pullback between the two warnings for another quarter. That second quarter would sell if the stop triggered. At this stage, I was managing the position against newer support, beyond my initial opening-range stop.
The topping candles were warnings I interpreted in context. I do not treat that candle shape as an automatic sell signal every time it appears.
I make a separate decision about overnight exposure
A close near the day’s high supports my confidence in holding. Fading gains, weakness in the peer group or a deteriorating broader market can change my mind.
CoreWeave’s return toward session VWAP makes that reassessment visible. I can like the morning entry and still want less exposure by the close. I judge what the stock is doing now alongside its peers and the market.
SOXL and Micron did not give me the same opening confidence
SOXL: the opening low failed first
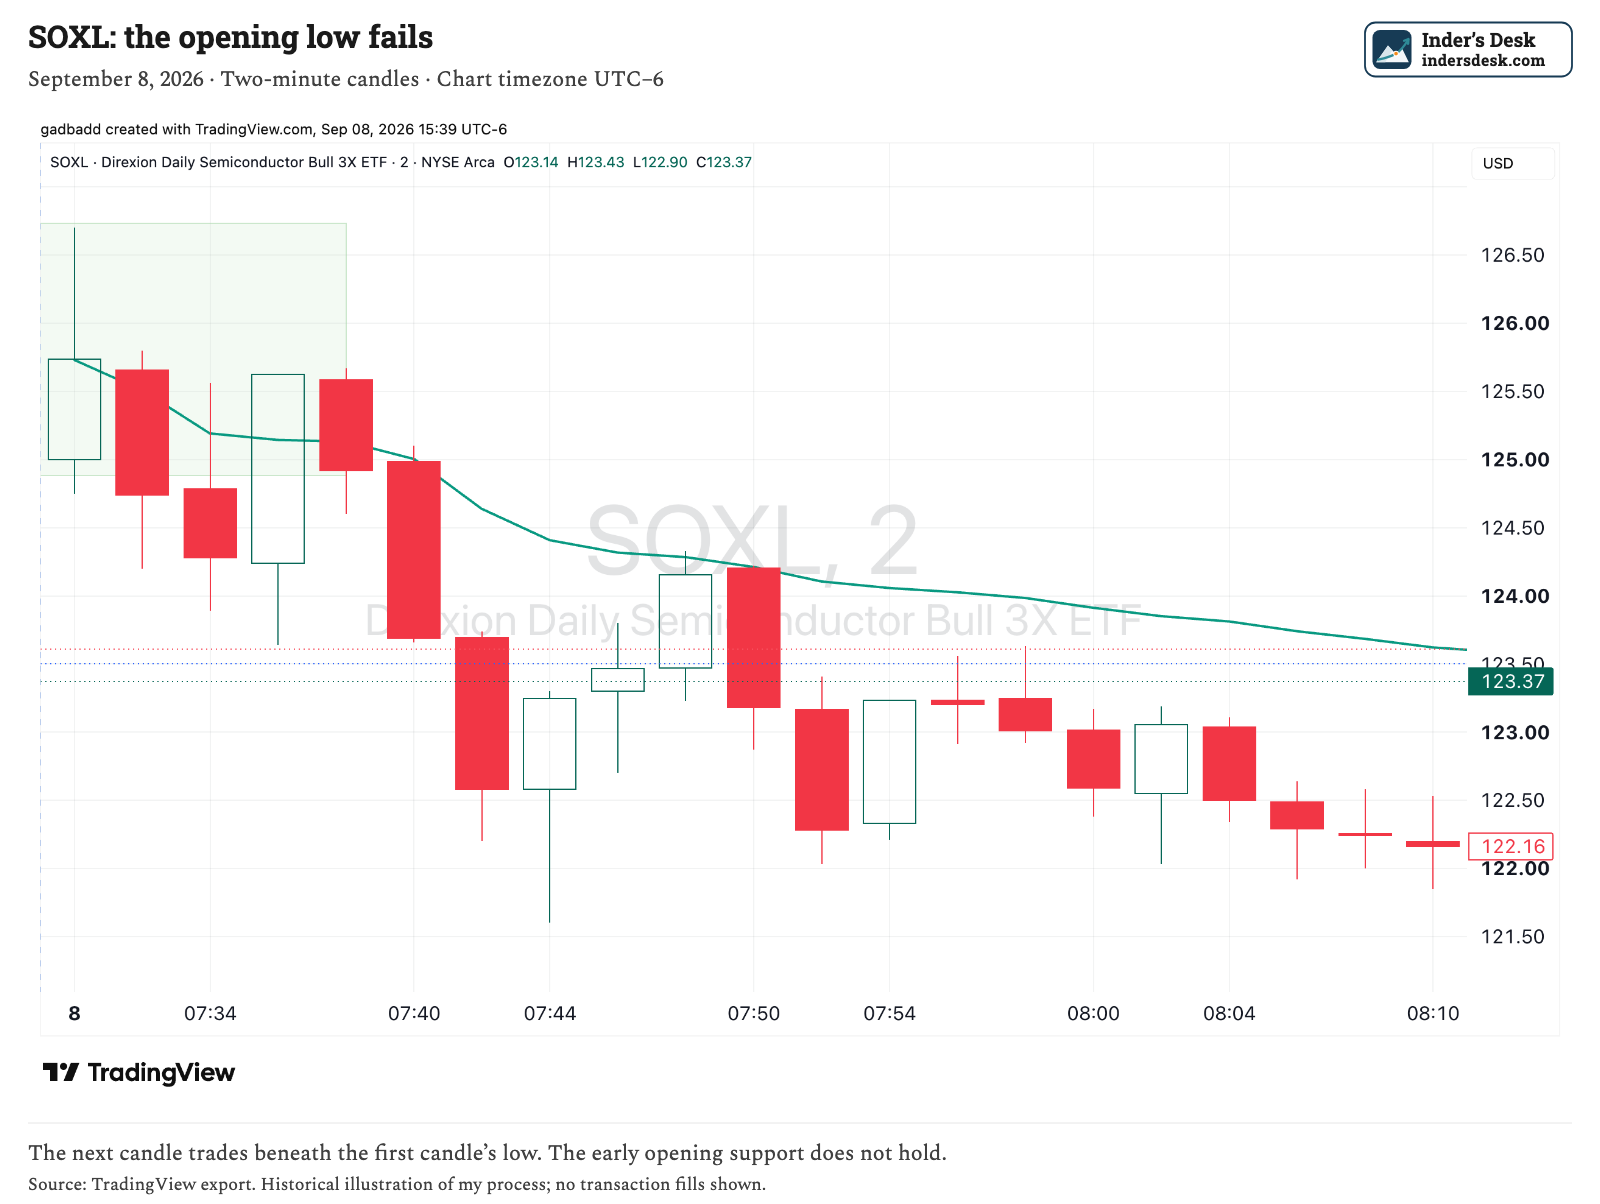
SOXL broke below its marked opening-range low early, then recovered and rallied before fading late beneath opening support and session VWAP. The early loss of support was my warning. The later rally did not erase it.
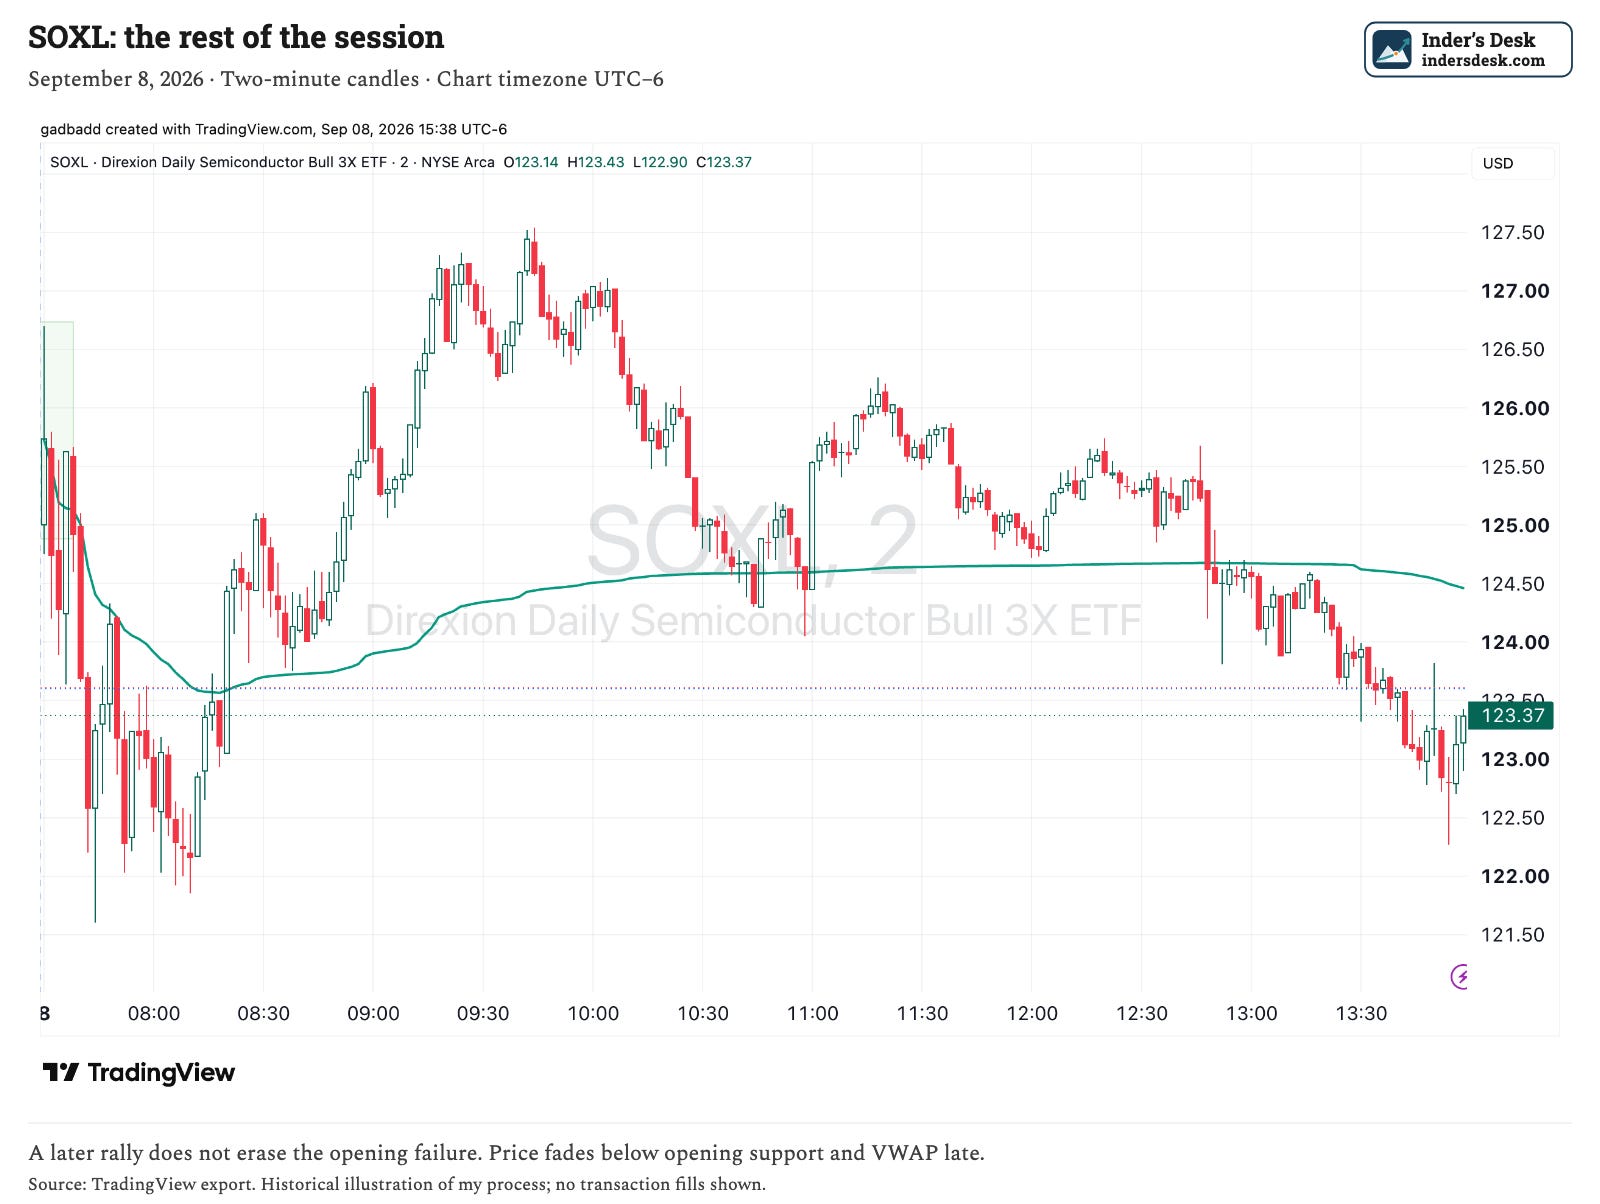
I cannot judge the opening entry from the day’s green percentage against the previous close. Those are different starting points. SOXL is the Direxion Daily Semiconductor Bull 3X ETF, a daily leveraged semiconductor fund, so I pay particular attention to the size of the exposure.
Micron: my basic trigger never arrived
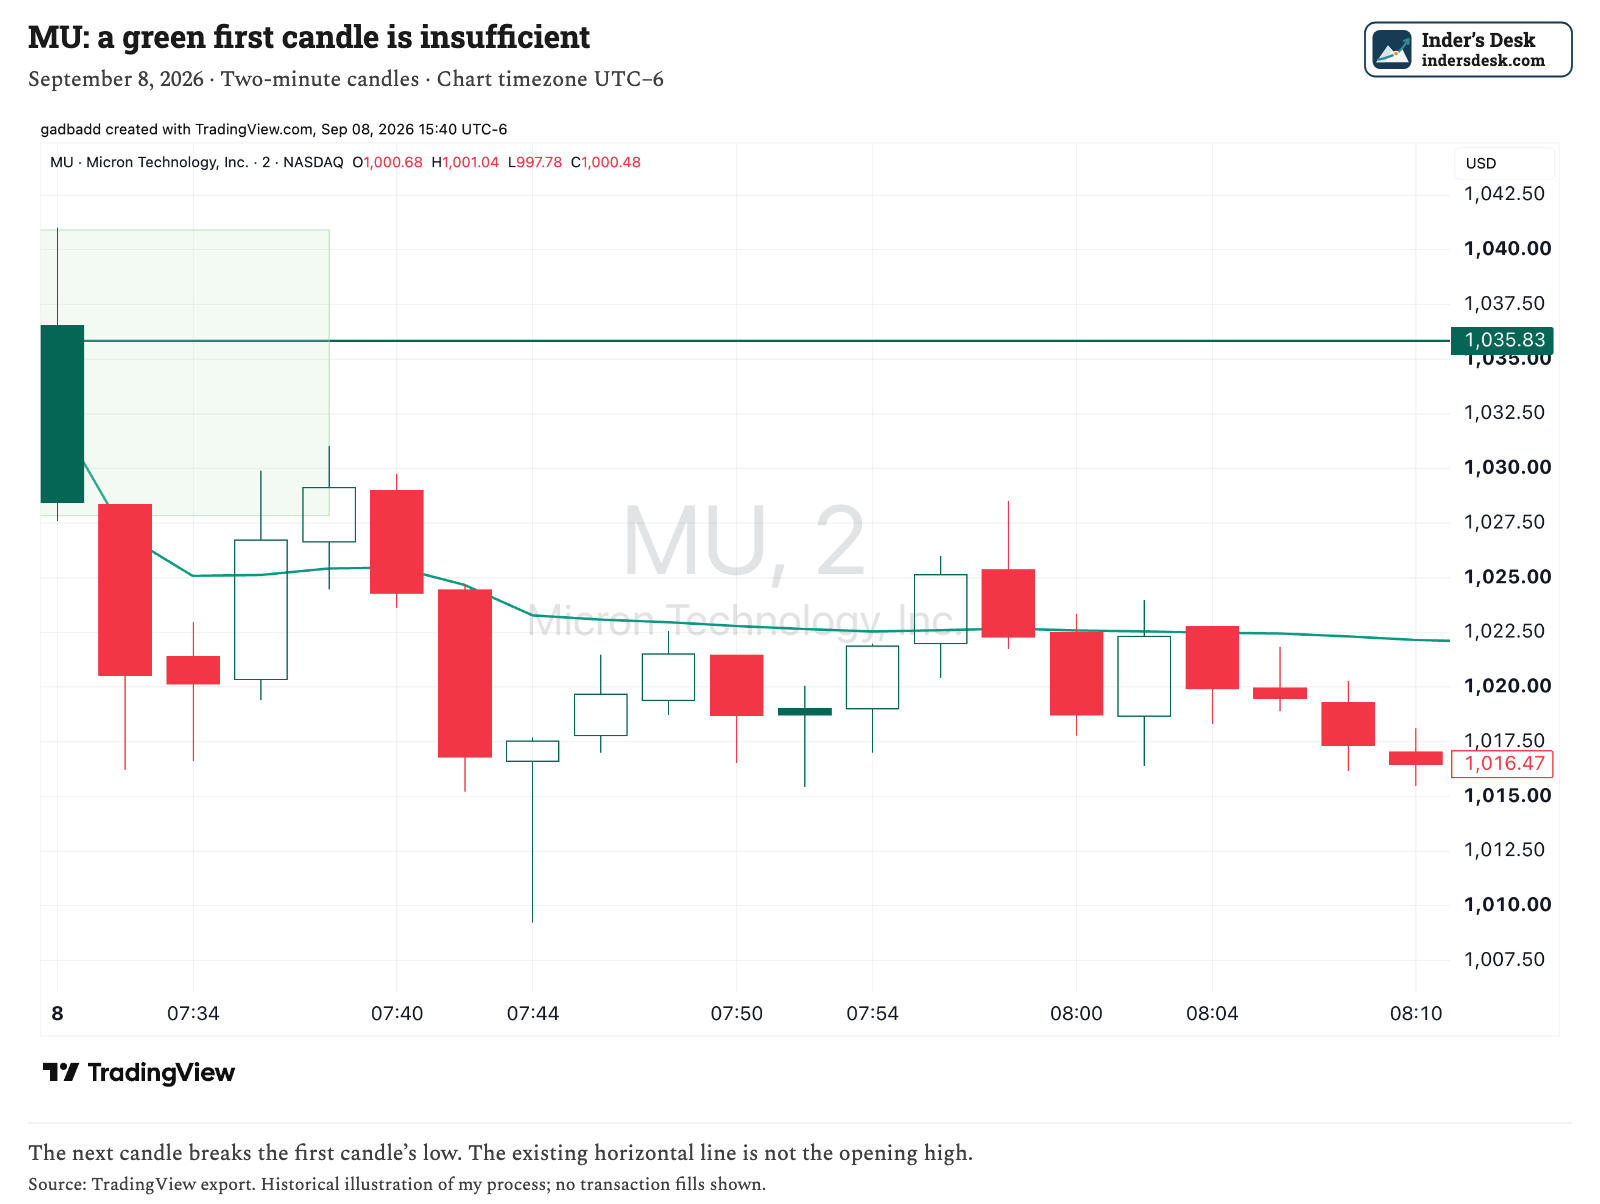
Micron’s first two-minute candle was tall and green, but the next candle fell below its low. The first candle’s high was never reclaimed in this full-session example. My opening-range-high trigger therefore never arrived.
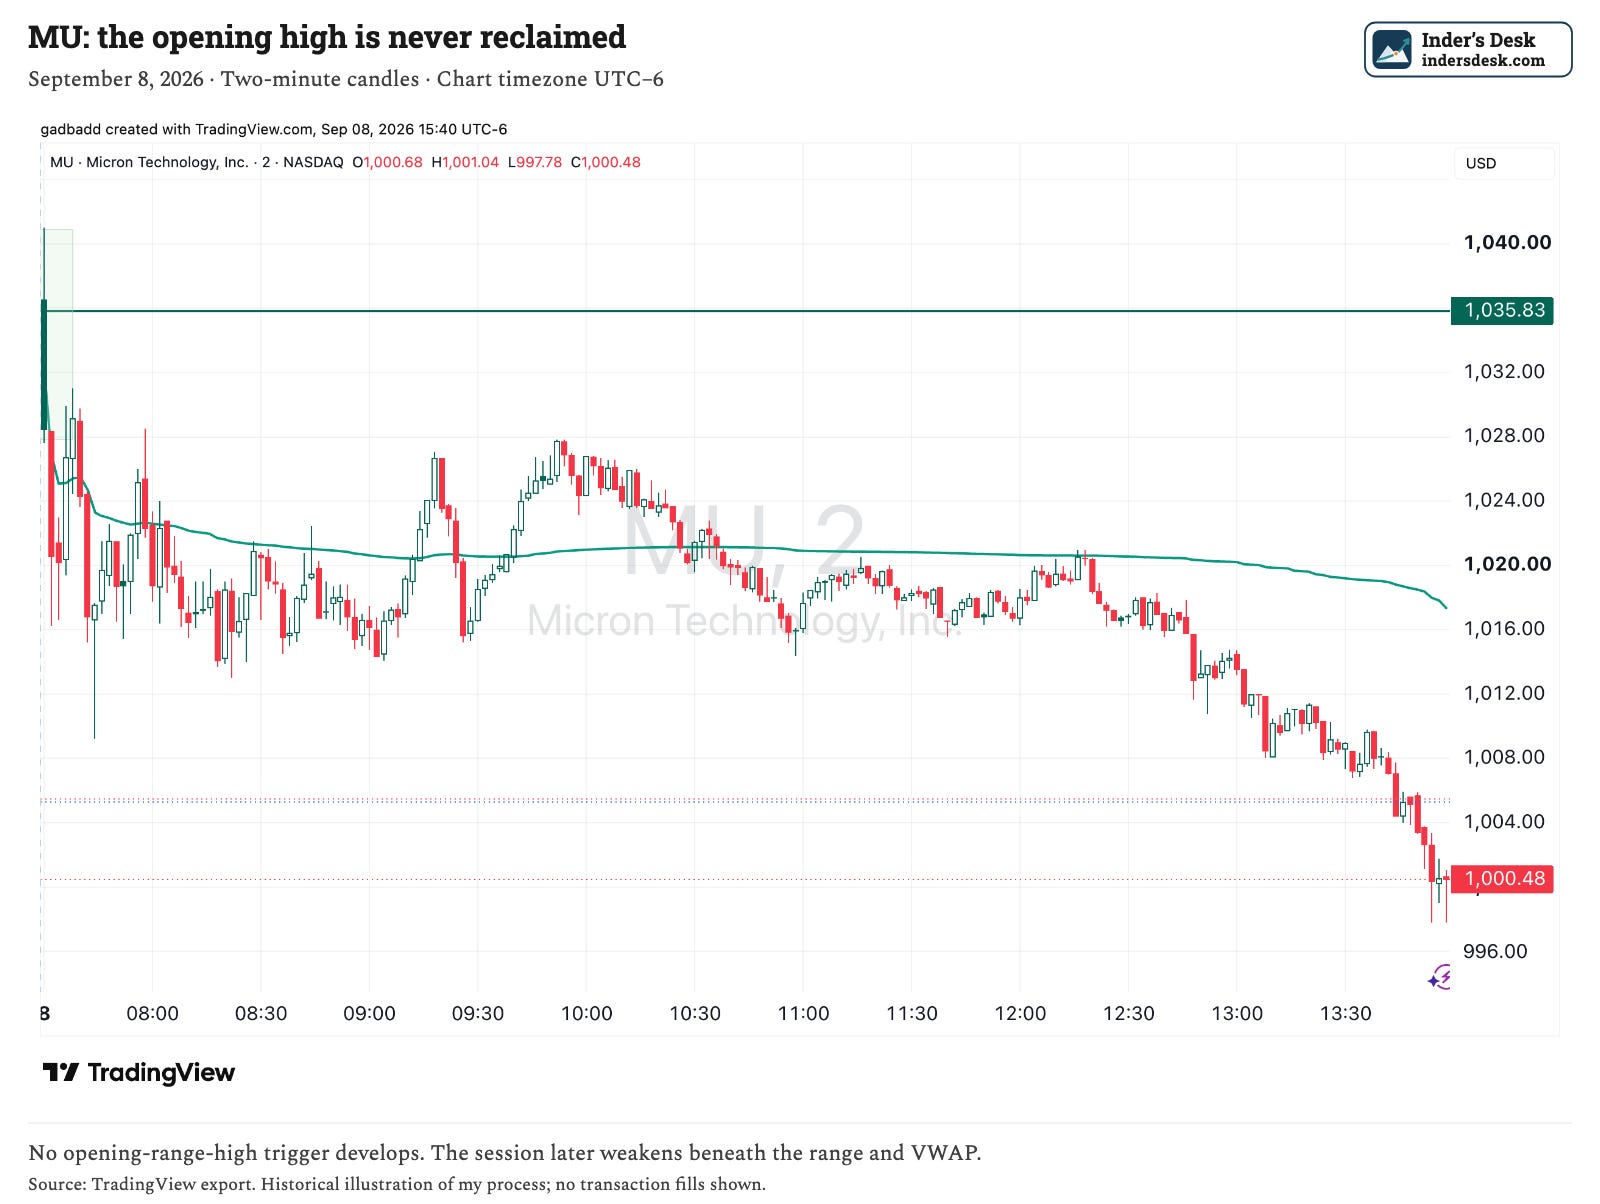
I had no reason to force that entry. The subsequent weakness illustrates the outcome, but my decision at the open had to rest on what I could see then.
How I put it together
I start with the opening range and watch whether buyers defend it. I define the stop and size before committing. Once I have a position, I reassess the price action, concentration and closing strength to decide how much to keep.
That is how I use opening range breakouts: a defined starting point, followed by active judgment as the trade develops.
Subscribe to Inder’s Desk for the research, breakout candidates and practical frameworks behind my decisions. If you already subscribe, sharing this episode with one trader is the most useful way to support the work.
Important: These examples explain my discretionary process. They are not a backtest or a recommendation to buy or sell. The chart views show September 8, 2026; their displayed timezone is UTC−6.
See More


Disclaimer:
This article is for informational and educational purposes only and does not constitute financial, investment, tax, or legal advice. Any opinions, scenarios, price targets, or market observations reflect my personal views and may change without notice. Investing and trading involve substantial risk, including the possible loss of principal. You are solely responsible for your own investment decisions, position sizing, risk management, and trades. Conduct your own research and consult a qualified professional where appropriate.


