



The semiconductor trade looked ready to break.
Then the breakdown failed.
That is the most important market signal I see heading into Tuesday’s reopening. The group reached the place where support was supposed to disappear, sellers had their chance, and timely buying arrived before weakness could accelerate. The result was not merely a bounce. It was what I call an un-breakdown: a bearish break that fails, reverses, and forces investors to reconsider which side has control.
I believe the next move can be explosive, and I am positioning for it while the reclaimed levels hold.
Prior Proof: When Failed Breaks Reverse
Nvidia supplied the first proof in July. NVDA threatened to break near $190 as it tested its rising 200-day moving average. Selling failed to accelerate, price reclaimed the average, and the stock then surged. That episode established the pattern I am applying to the group today.
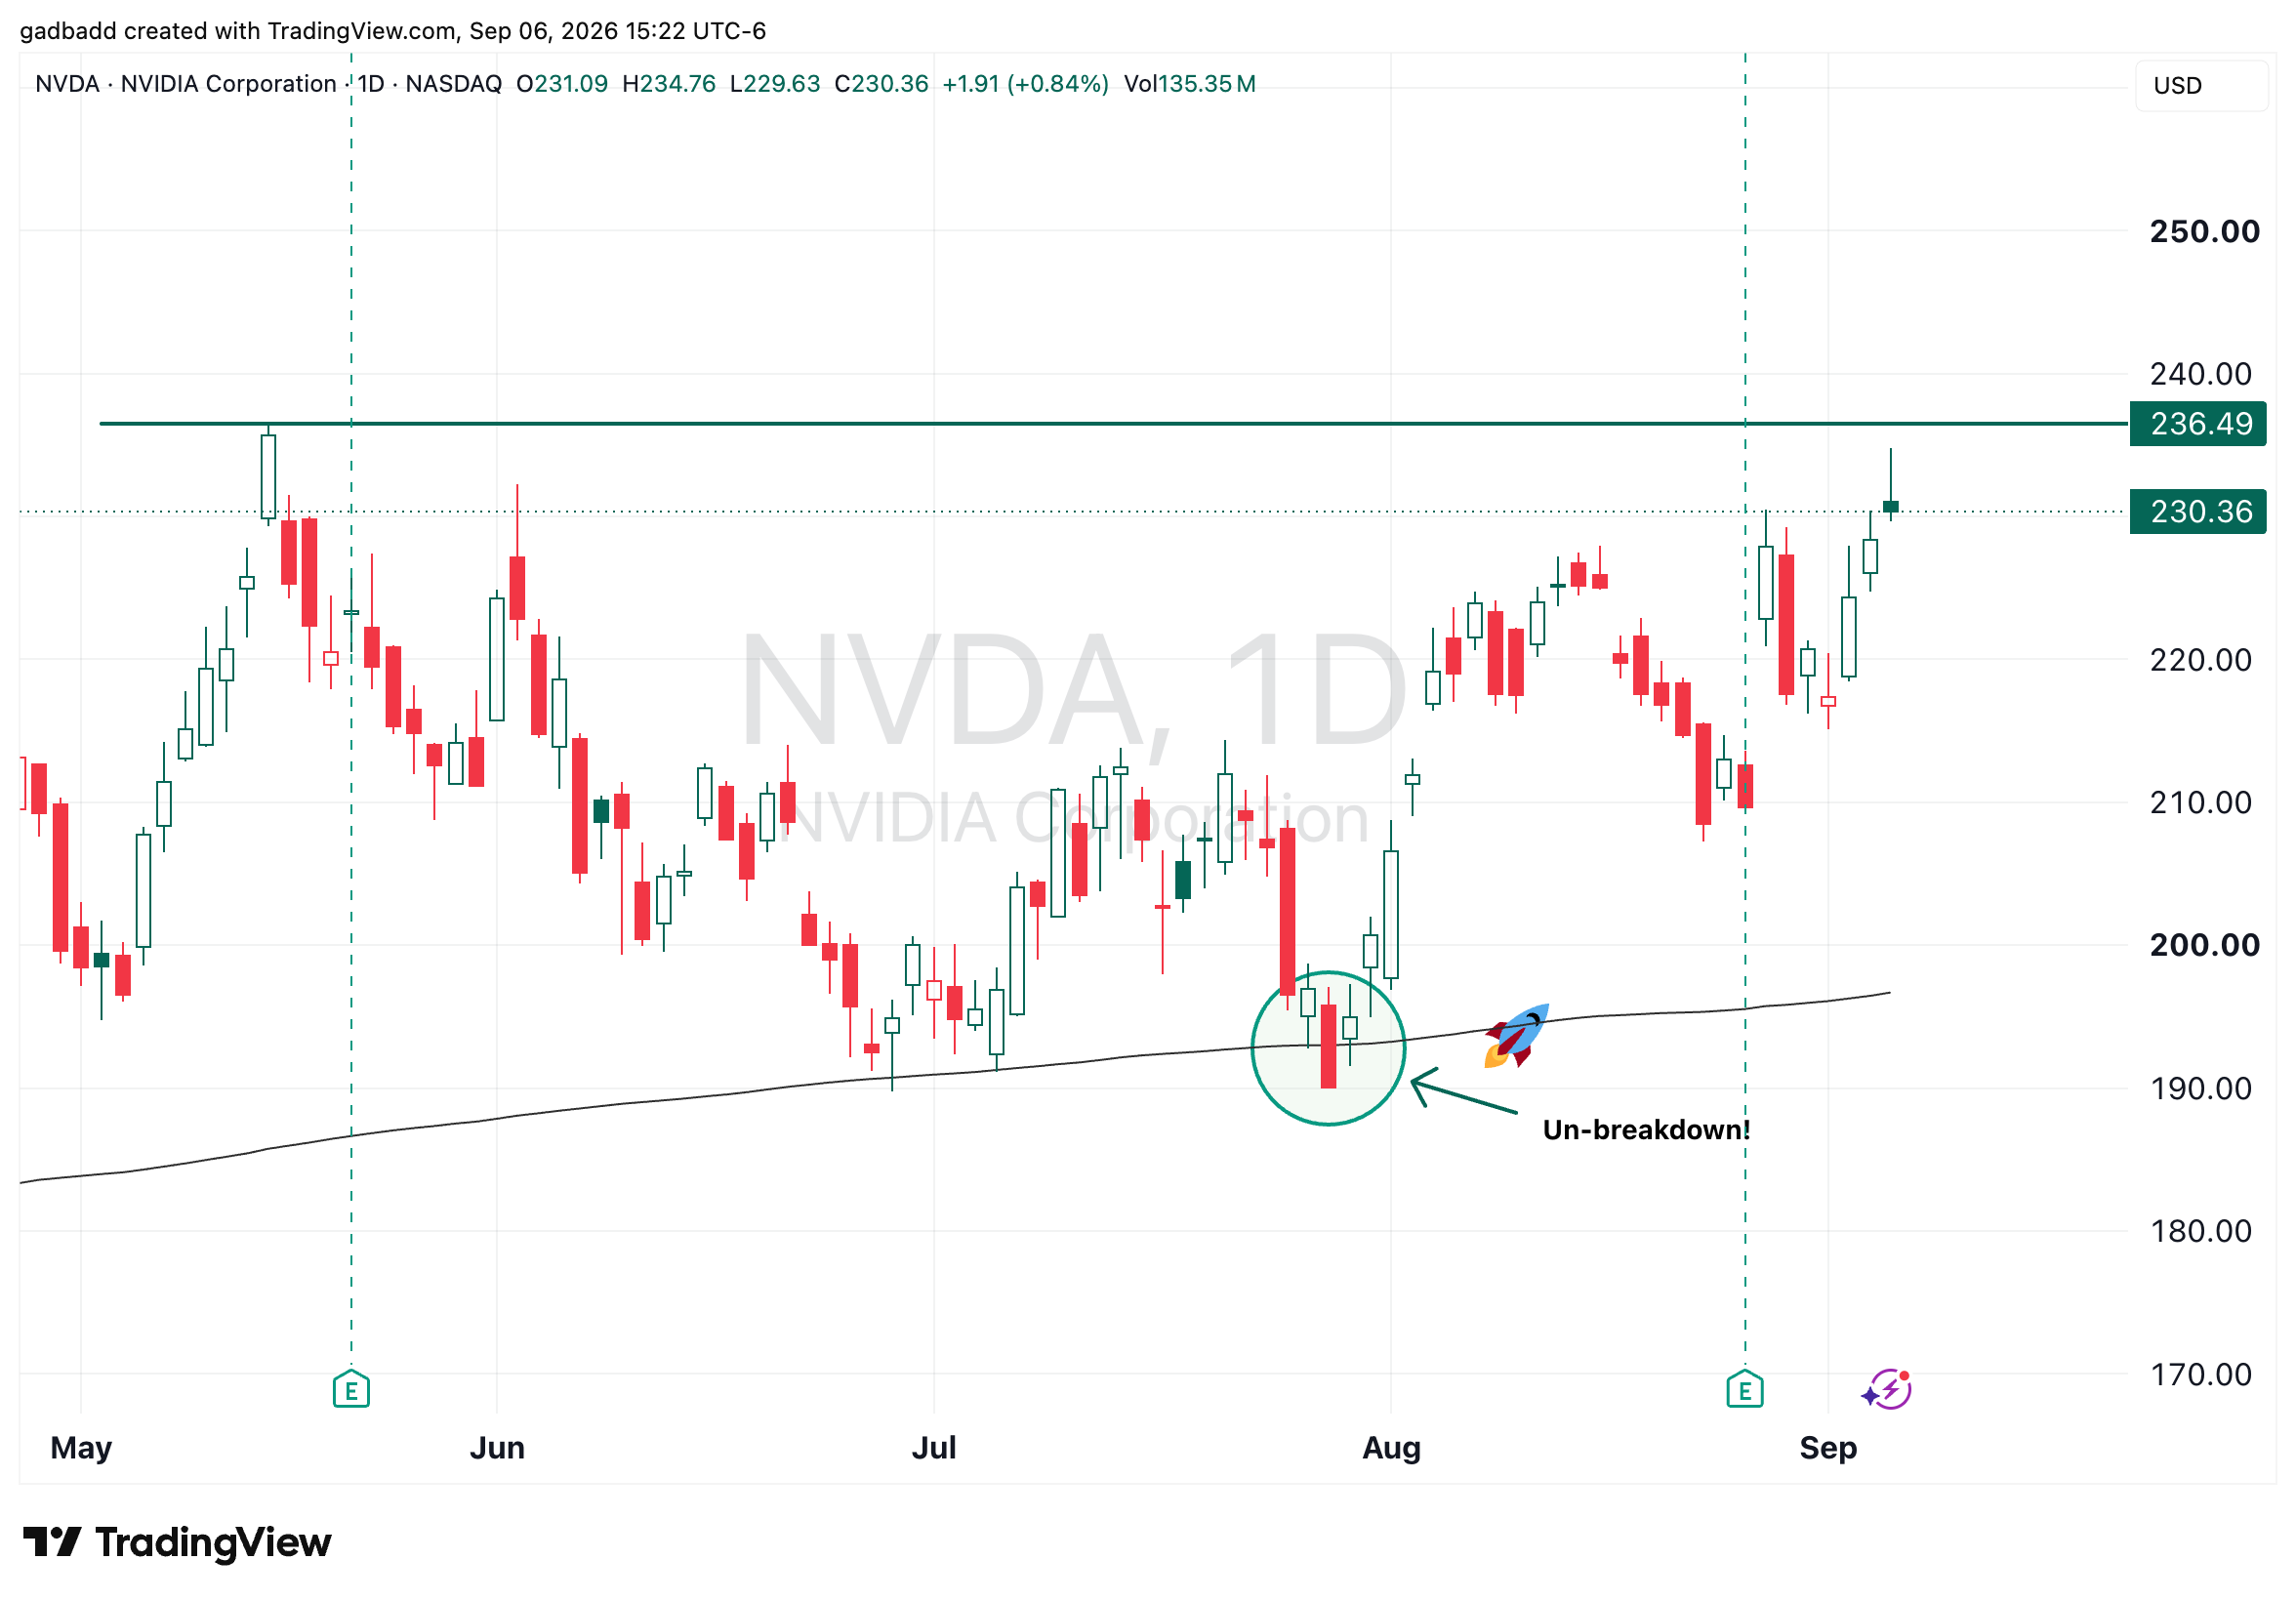
NVDA daily through September 4, 2026. The annotated late-July test near $190 marks the failed breakdown at the rising 200-day moving average.
Coinbase supplied a second case study. Its trigger was horizontal prior-low support, not a moving average. COIN rallied about 41% from the chart’s $139 support line to the September 3 high. It is historical evidence, not a current watchlist name.
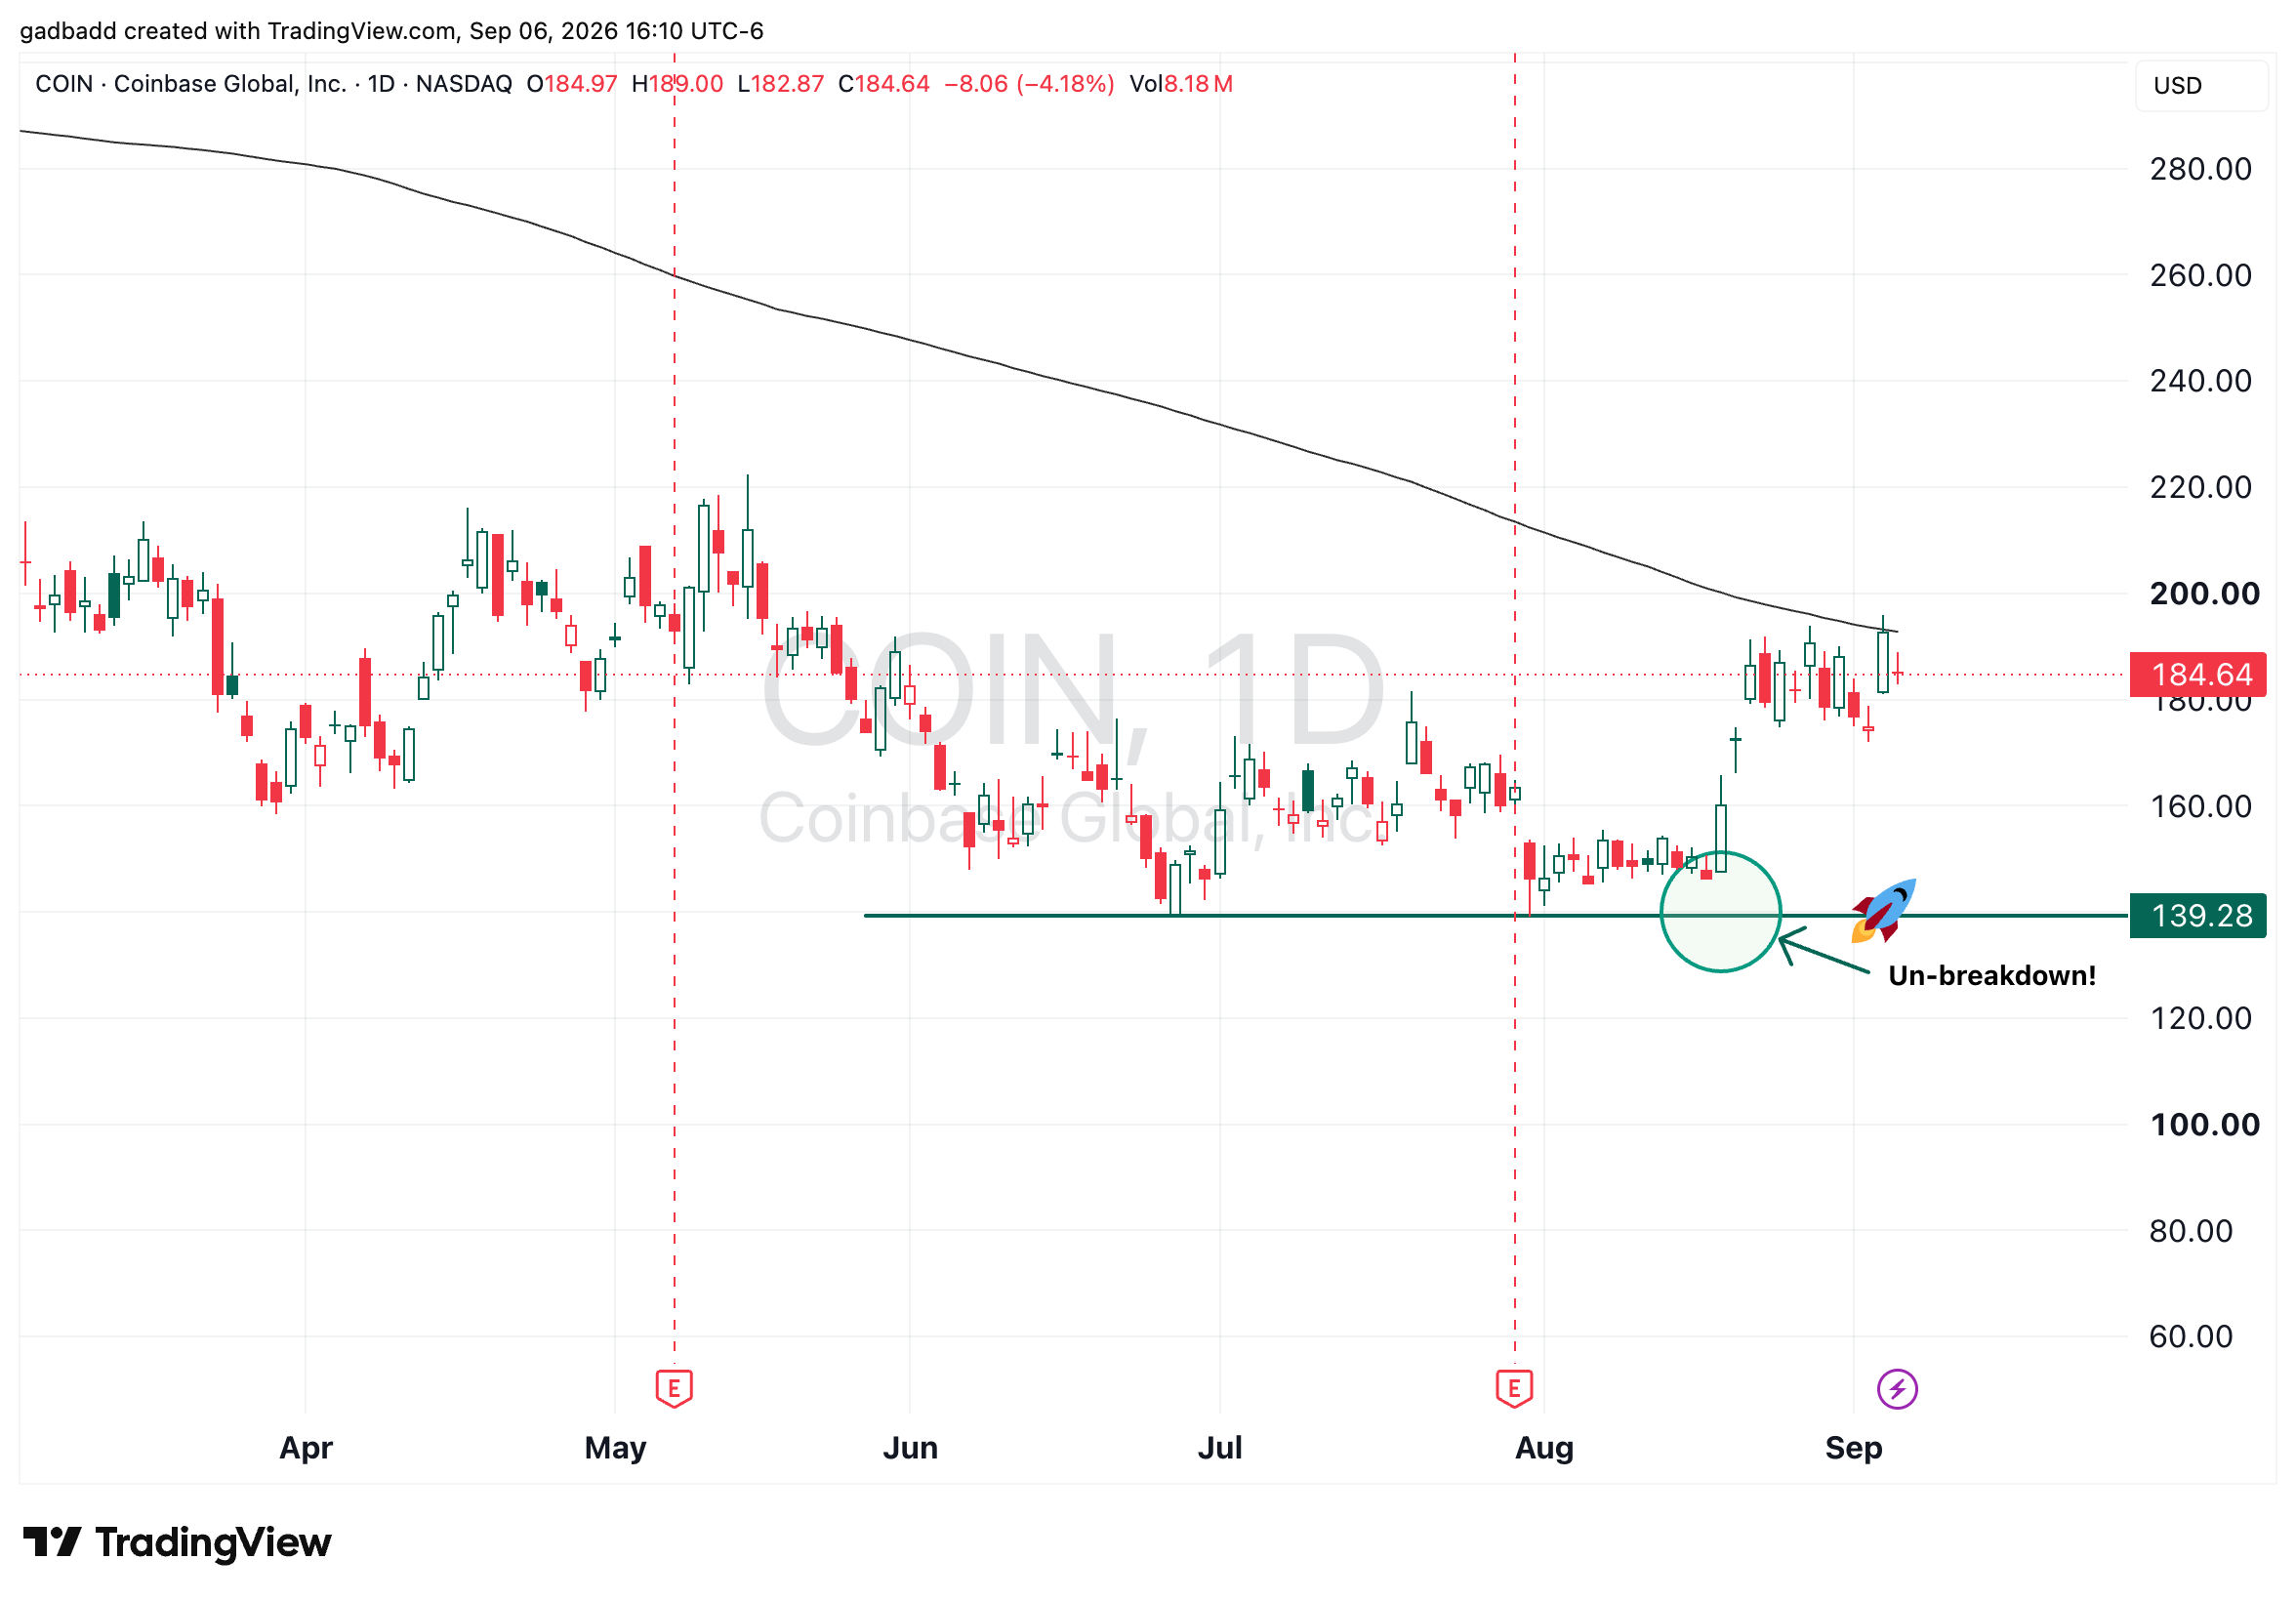
COIN daily through September 4, 2026. The horizontal $139.28 support line marks the failed breakdown; the September 3 high was $195.85.
Strategy was even more explosive, rising about 54% from its August 19 low to the September 3 high. MSTR is also a historical case study, not a current watchlist name.
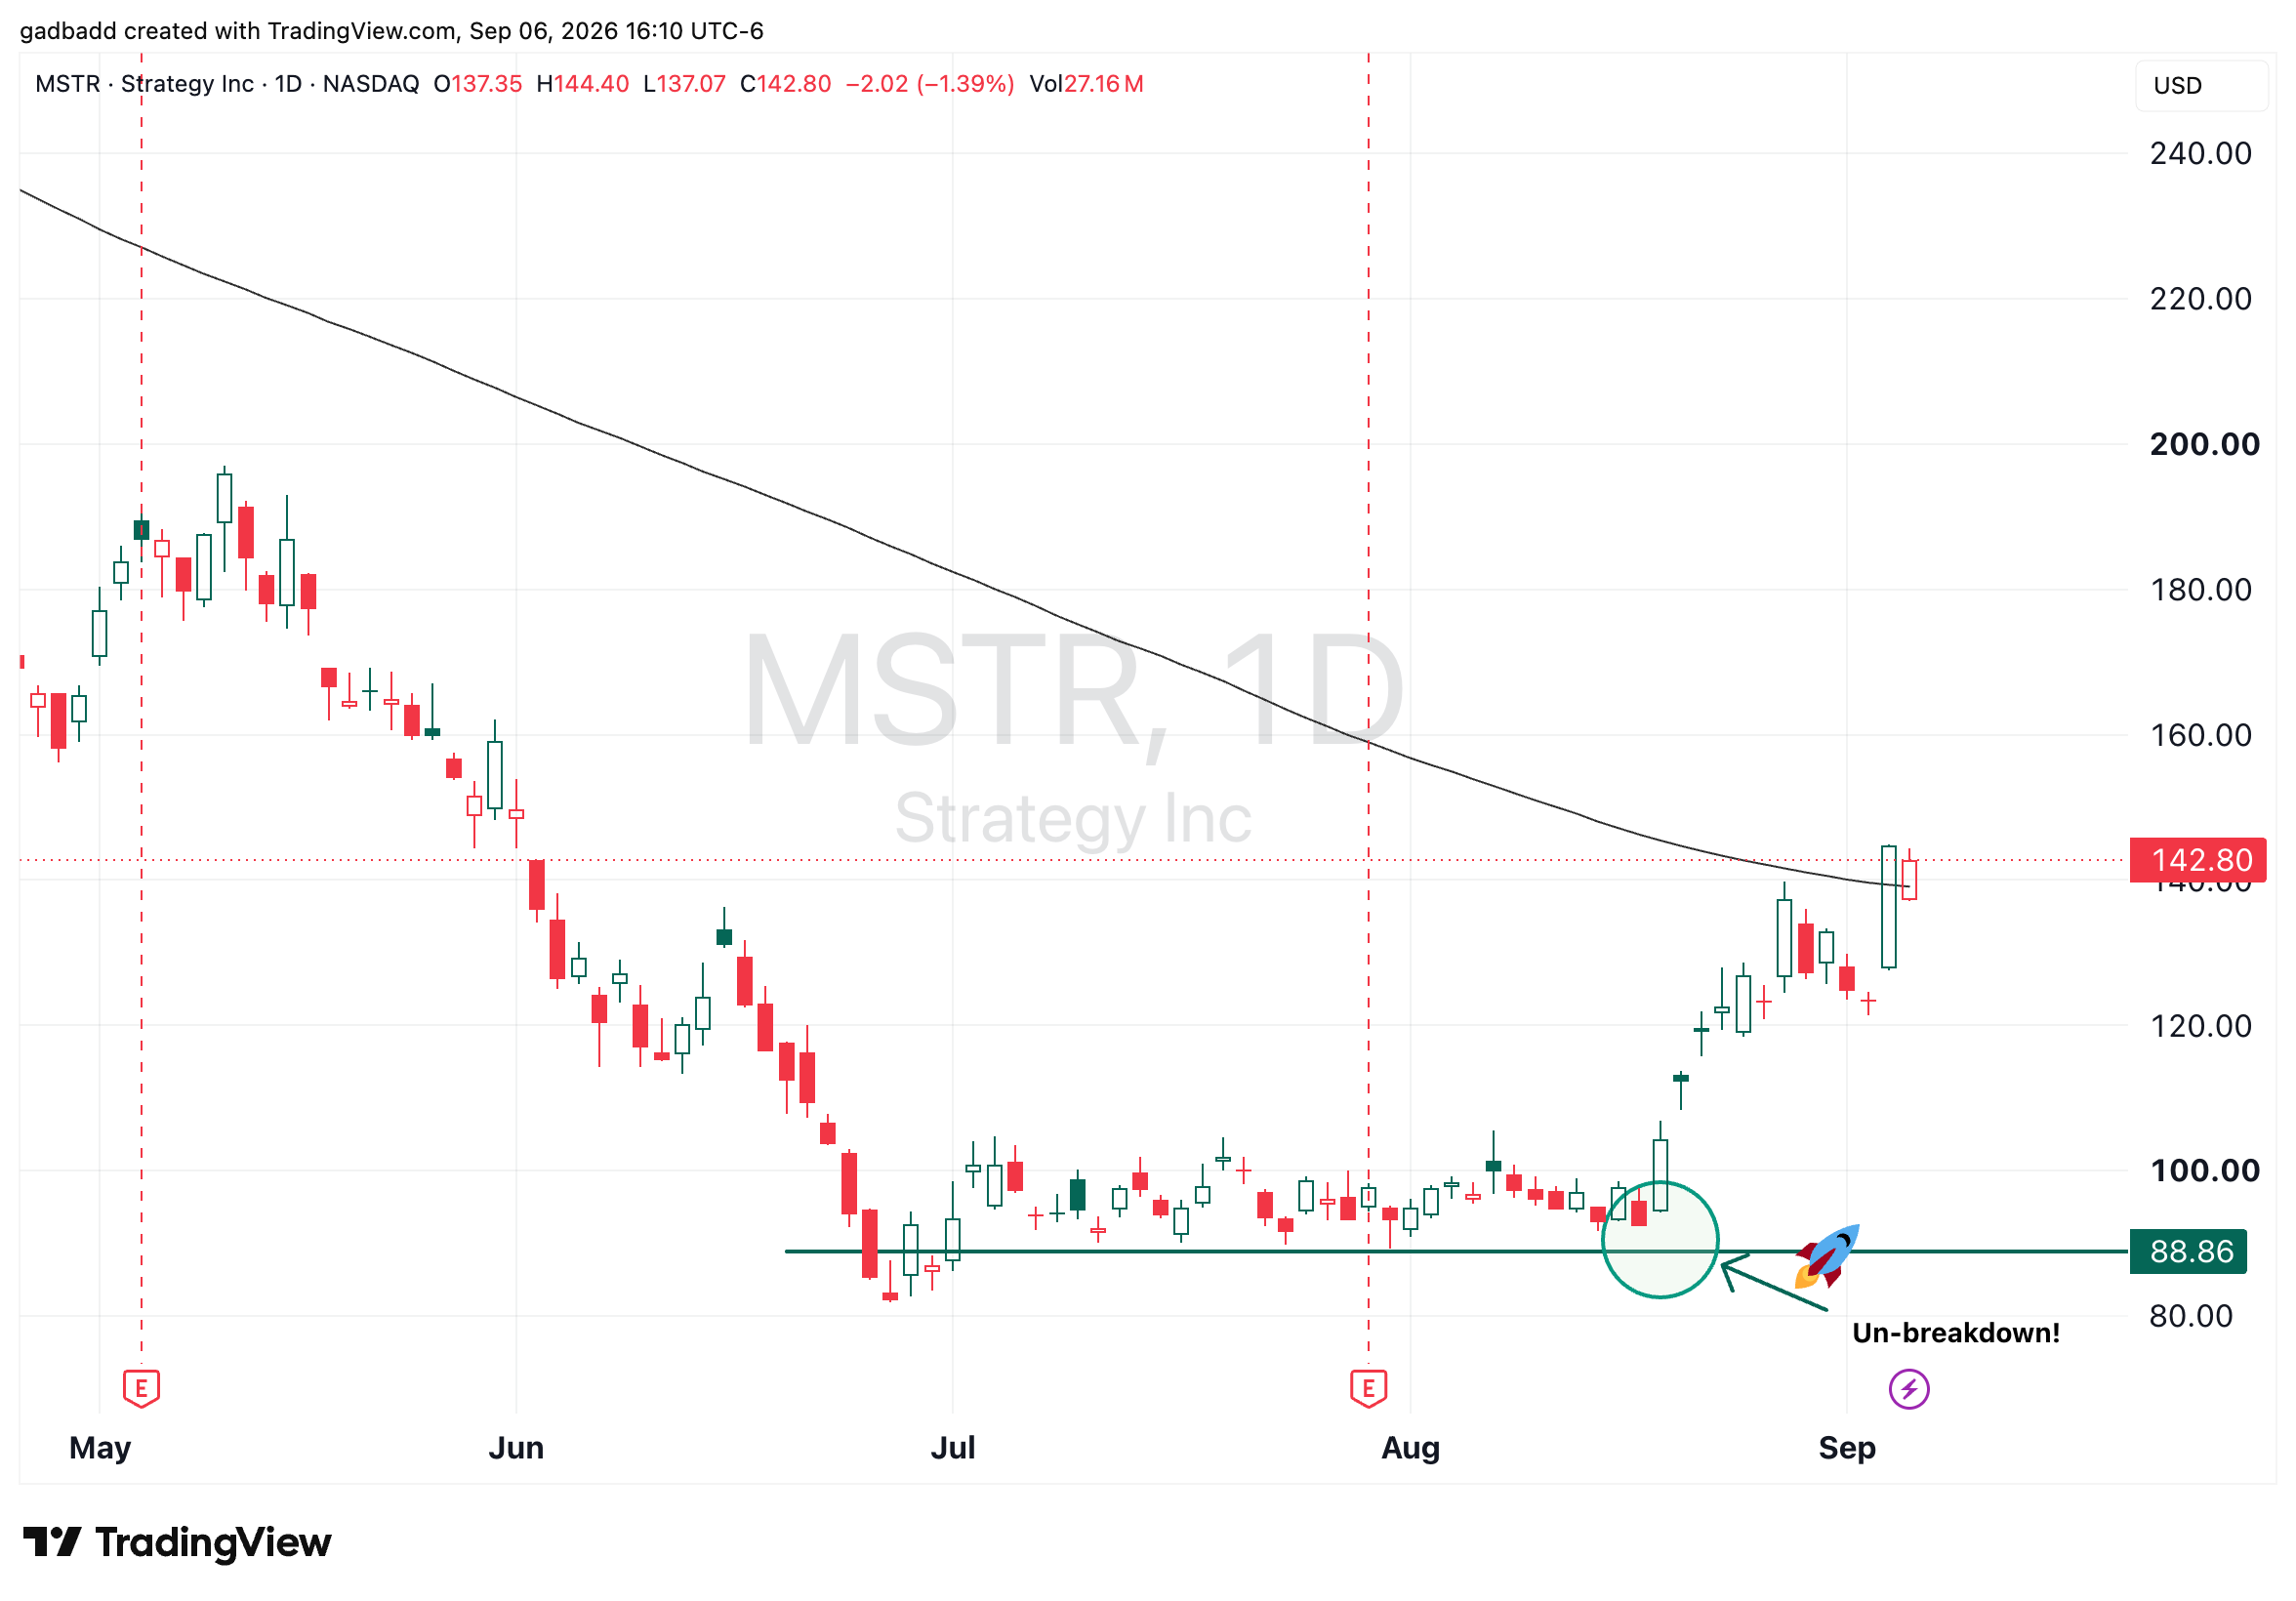
MSTR daily through September 4, 2026. Strategy rose about 54% from its August 19 low to the September 3 high after the failed break.
The lesson is the same across all three: when an obvious break fails and price reclaims the level quickly, trapped sellers can become fuel for the move in the opposite direction.
Now the question is whether semiconductors are setting up the same way at the group level.
Current Semiconductor Evidence
Start with the market’s relative vote. The chart divides SOXX, the semiconductor ETF, by IGV, the software ETF. A rising line means semiconductors are outperforming software. The ratio has just bounced from its rising 200-day simple moving average, its first test since August 2025. After that earlier test, the SOXX/IGV ratio (not SOXX itself) rose from roughly 2.3 to roughly 7.5 at its June 2026 peak, a gain of about 225%. So, that outperformance, lasted a very long time.
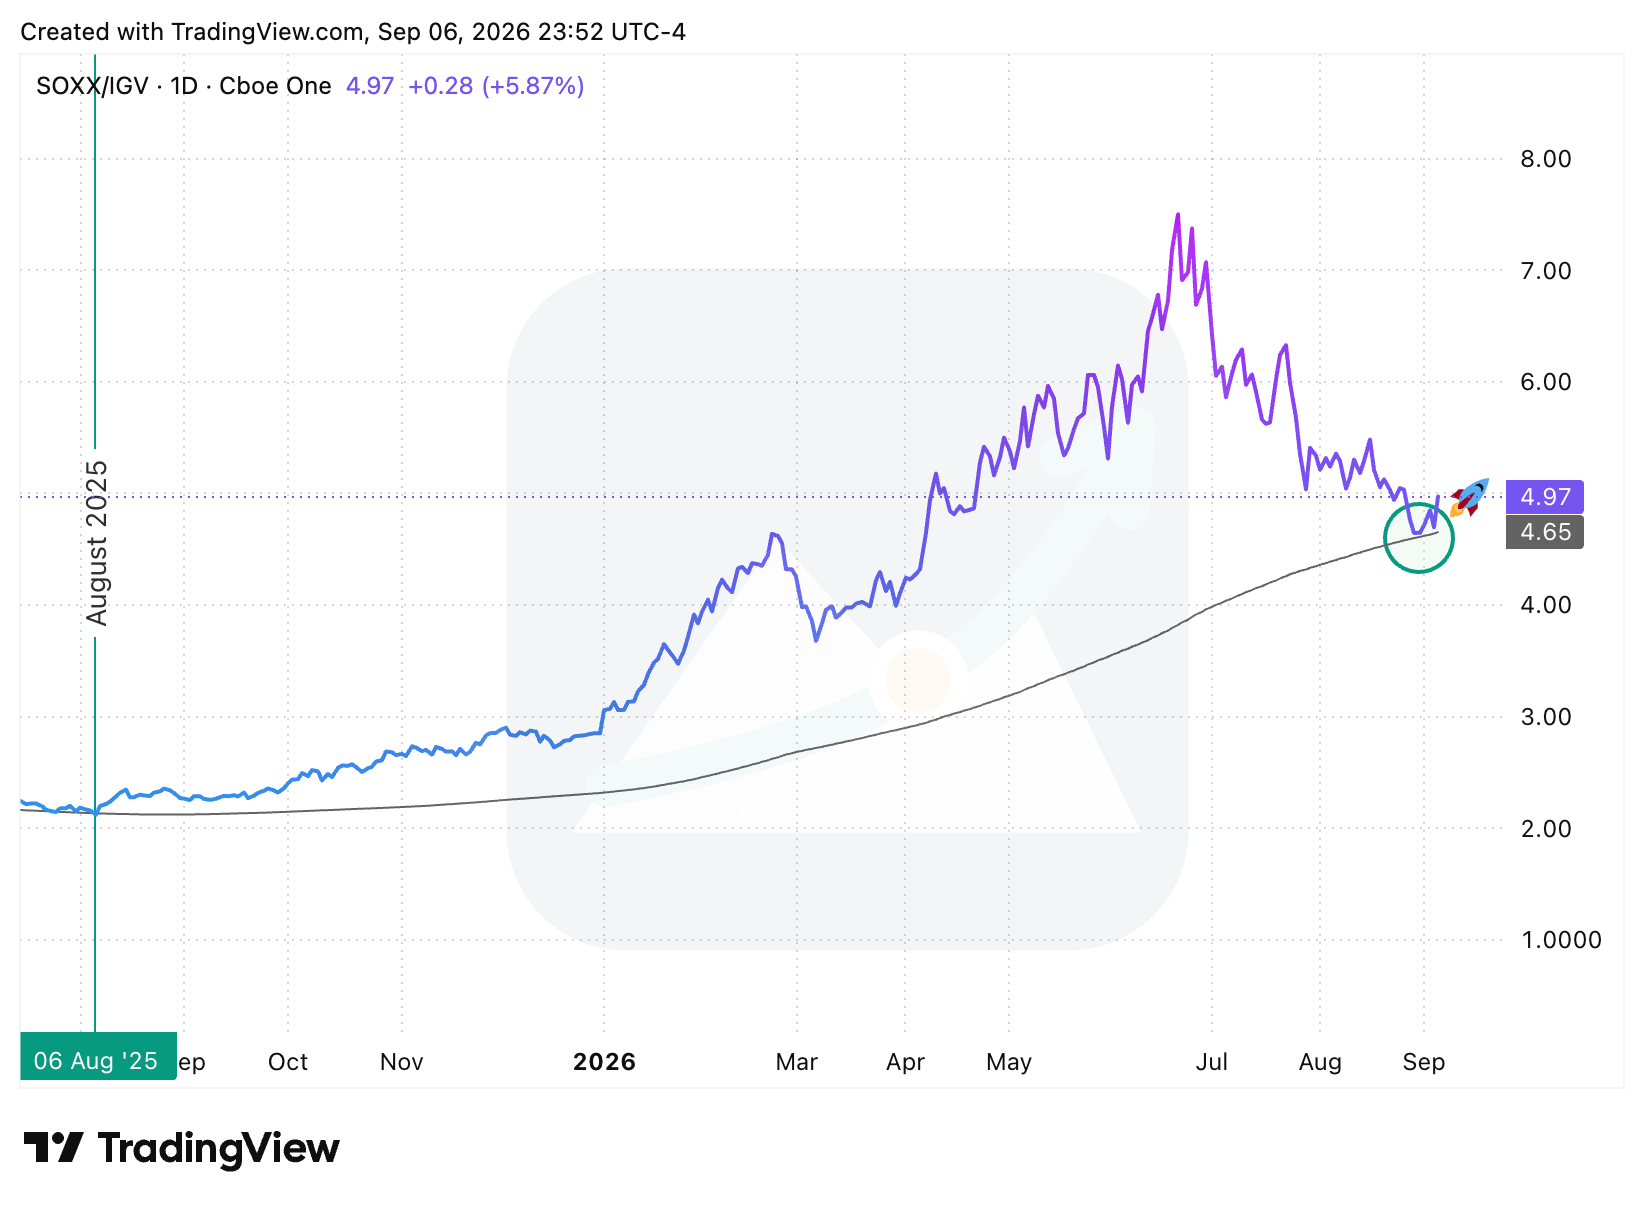
SOXX/IGV daily ratio through September 4, 2026. Teal: the ratio; black: the 200-day simple moving average.
The tape confirmed the ratio. Among the 52 AI-universe names that moved at least 5% Friday, more than three dozen semiconductor, semicap-equipment, memory, and optics stocks rose; every software name crossing the same threshold fell.
Chips gained even as stronger payroll data increased rate pressure and the major indexes declined. That is genuine sector rotation, and confirmation of the failed-breakdown thesis.
What I Mean by an “Un-Breakdown”
An un-breakdown has four parts:
Price reaches or briefly loses an obvious support level.
The expected wave of selling fails to appear.
Price quickly reclaims the level and begins to outperform.
Sidelined buyers step in, shorts cover, and bearish positioning unwinds, adding demand and accelerating the reversal.
What makes the setup valuable is simpler: it creates an observable decision point. If the reclaim holds, the buyers remain in control. If price loses the reversal low, the signal failed.
The Group-Level Test
SMH held the shelf
The first test is the VanEck Semiconductor ETF. On the weekly chart, SMH threatened to lose a horizontal shelf near $538 while a descending trendline pressed from above. The break never gained traction. SMH closed the week near $567, up 2.5% and back above the shelf. That is the group-level un-breakdown: support held as the chart compressed.
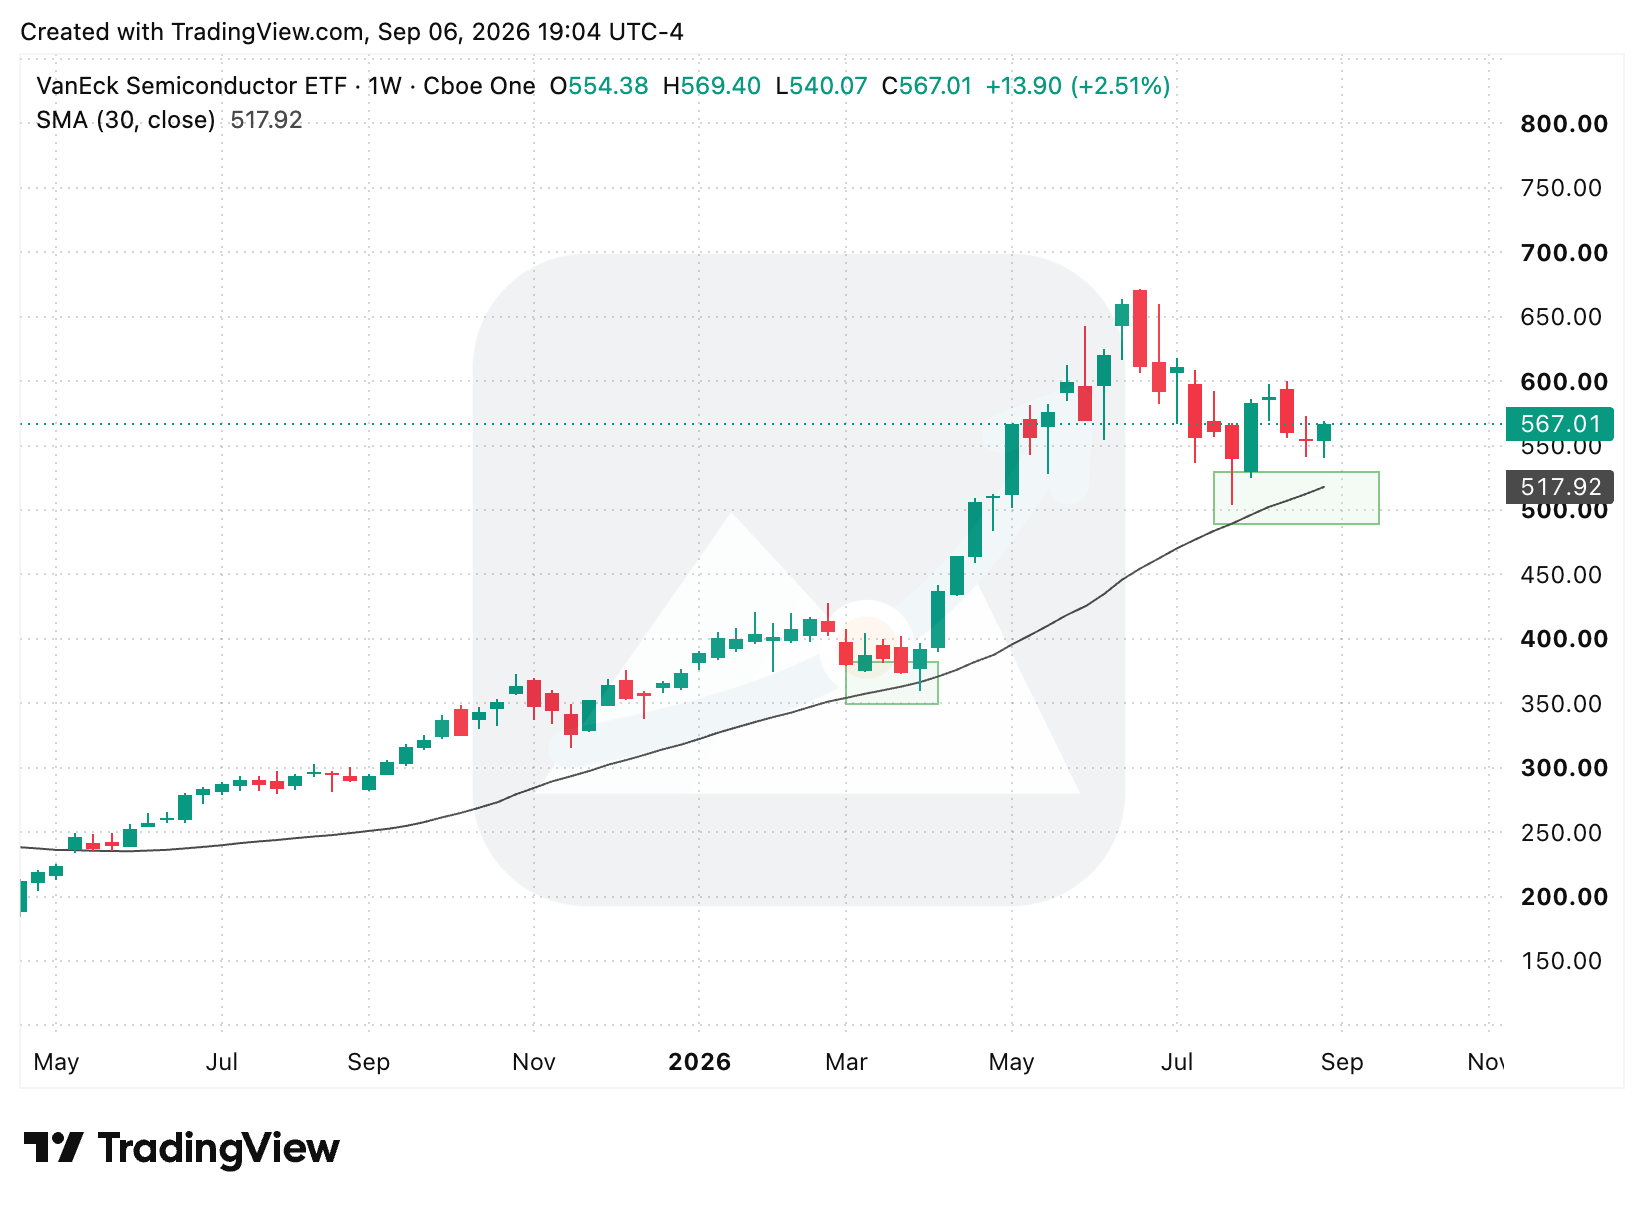
SMH weekly through September 4, 2026. The annotated shelf at $538.18 marks the threatened breakdown; the latest weekly close was $567.01.
Memory confirmed the move
Memory supplied a second group signal. DRAM is the Roundhill Memory ETF, an actively managed basket of global memory-chip companies tied to HBM, DRAM, NAND, SSD and related technologies. The daily chart compressed between converging trendlines, threatened the lower boundary in the mid-$50s, then closed at $59.69, up 6.6%, through the upper boundary.
Memory led the move: SanDisk rose roughly 12%, Micron roughly 6%, and the memory group roughly 4%.
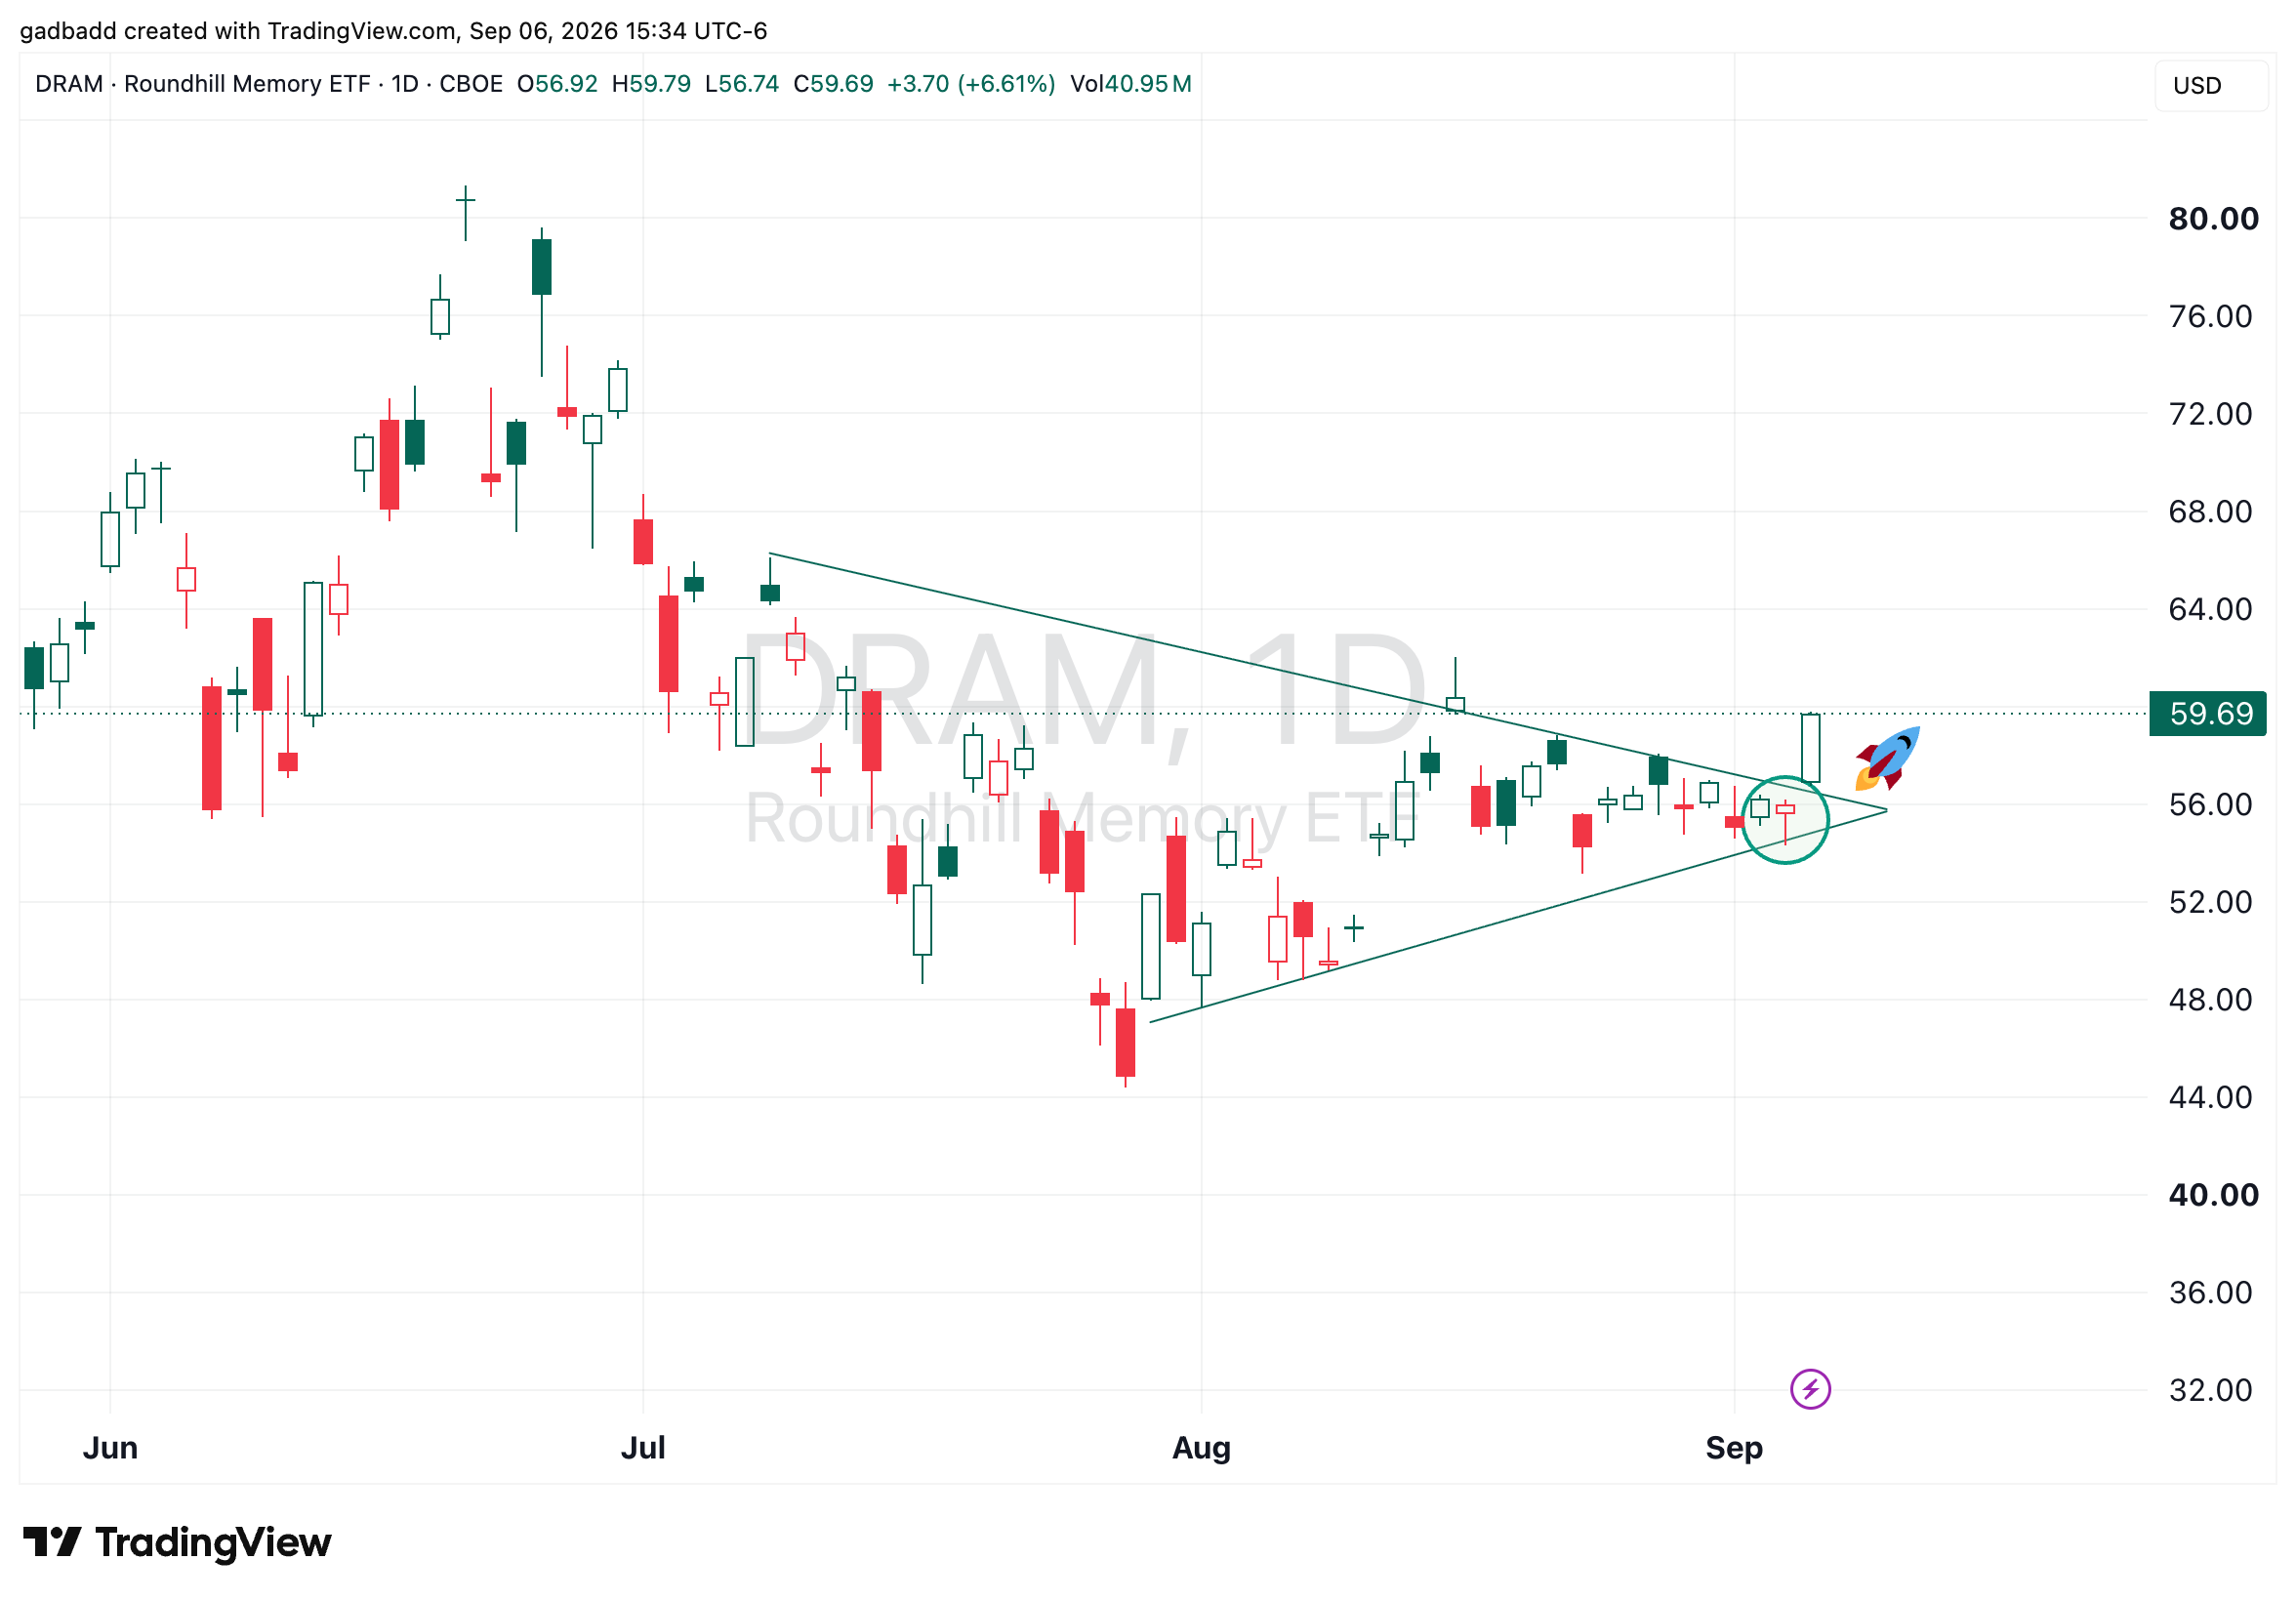
DRAM daily through September 4, 2026. The Roundhill Memory ETF closed at $59.69, up 6.6%, after breaking through the upper boundary of the annotated triangle.
SMH holds the failed-breakdown thesis above $538. DRAM confirms with follow-through above $60 and fails if it closes back below the triangle near $54 to $55.
Micron is the strongest current setup
Micron is one of the strongest current setups I see in the market—and I am long MU.
The daily chart shows a rounded multi-bottom base pressing against resistance near $1,040. MU closed Friday at $1,017 after a 6.1% gain, just beneath that line. A decisive close above $1,040 would confirm the breakout. The arrow toward roughly $1,200 marks the prior-high area, not a guaranteed target.
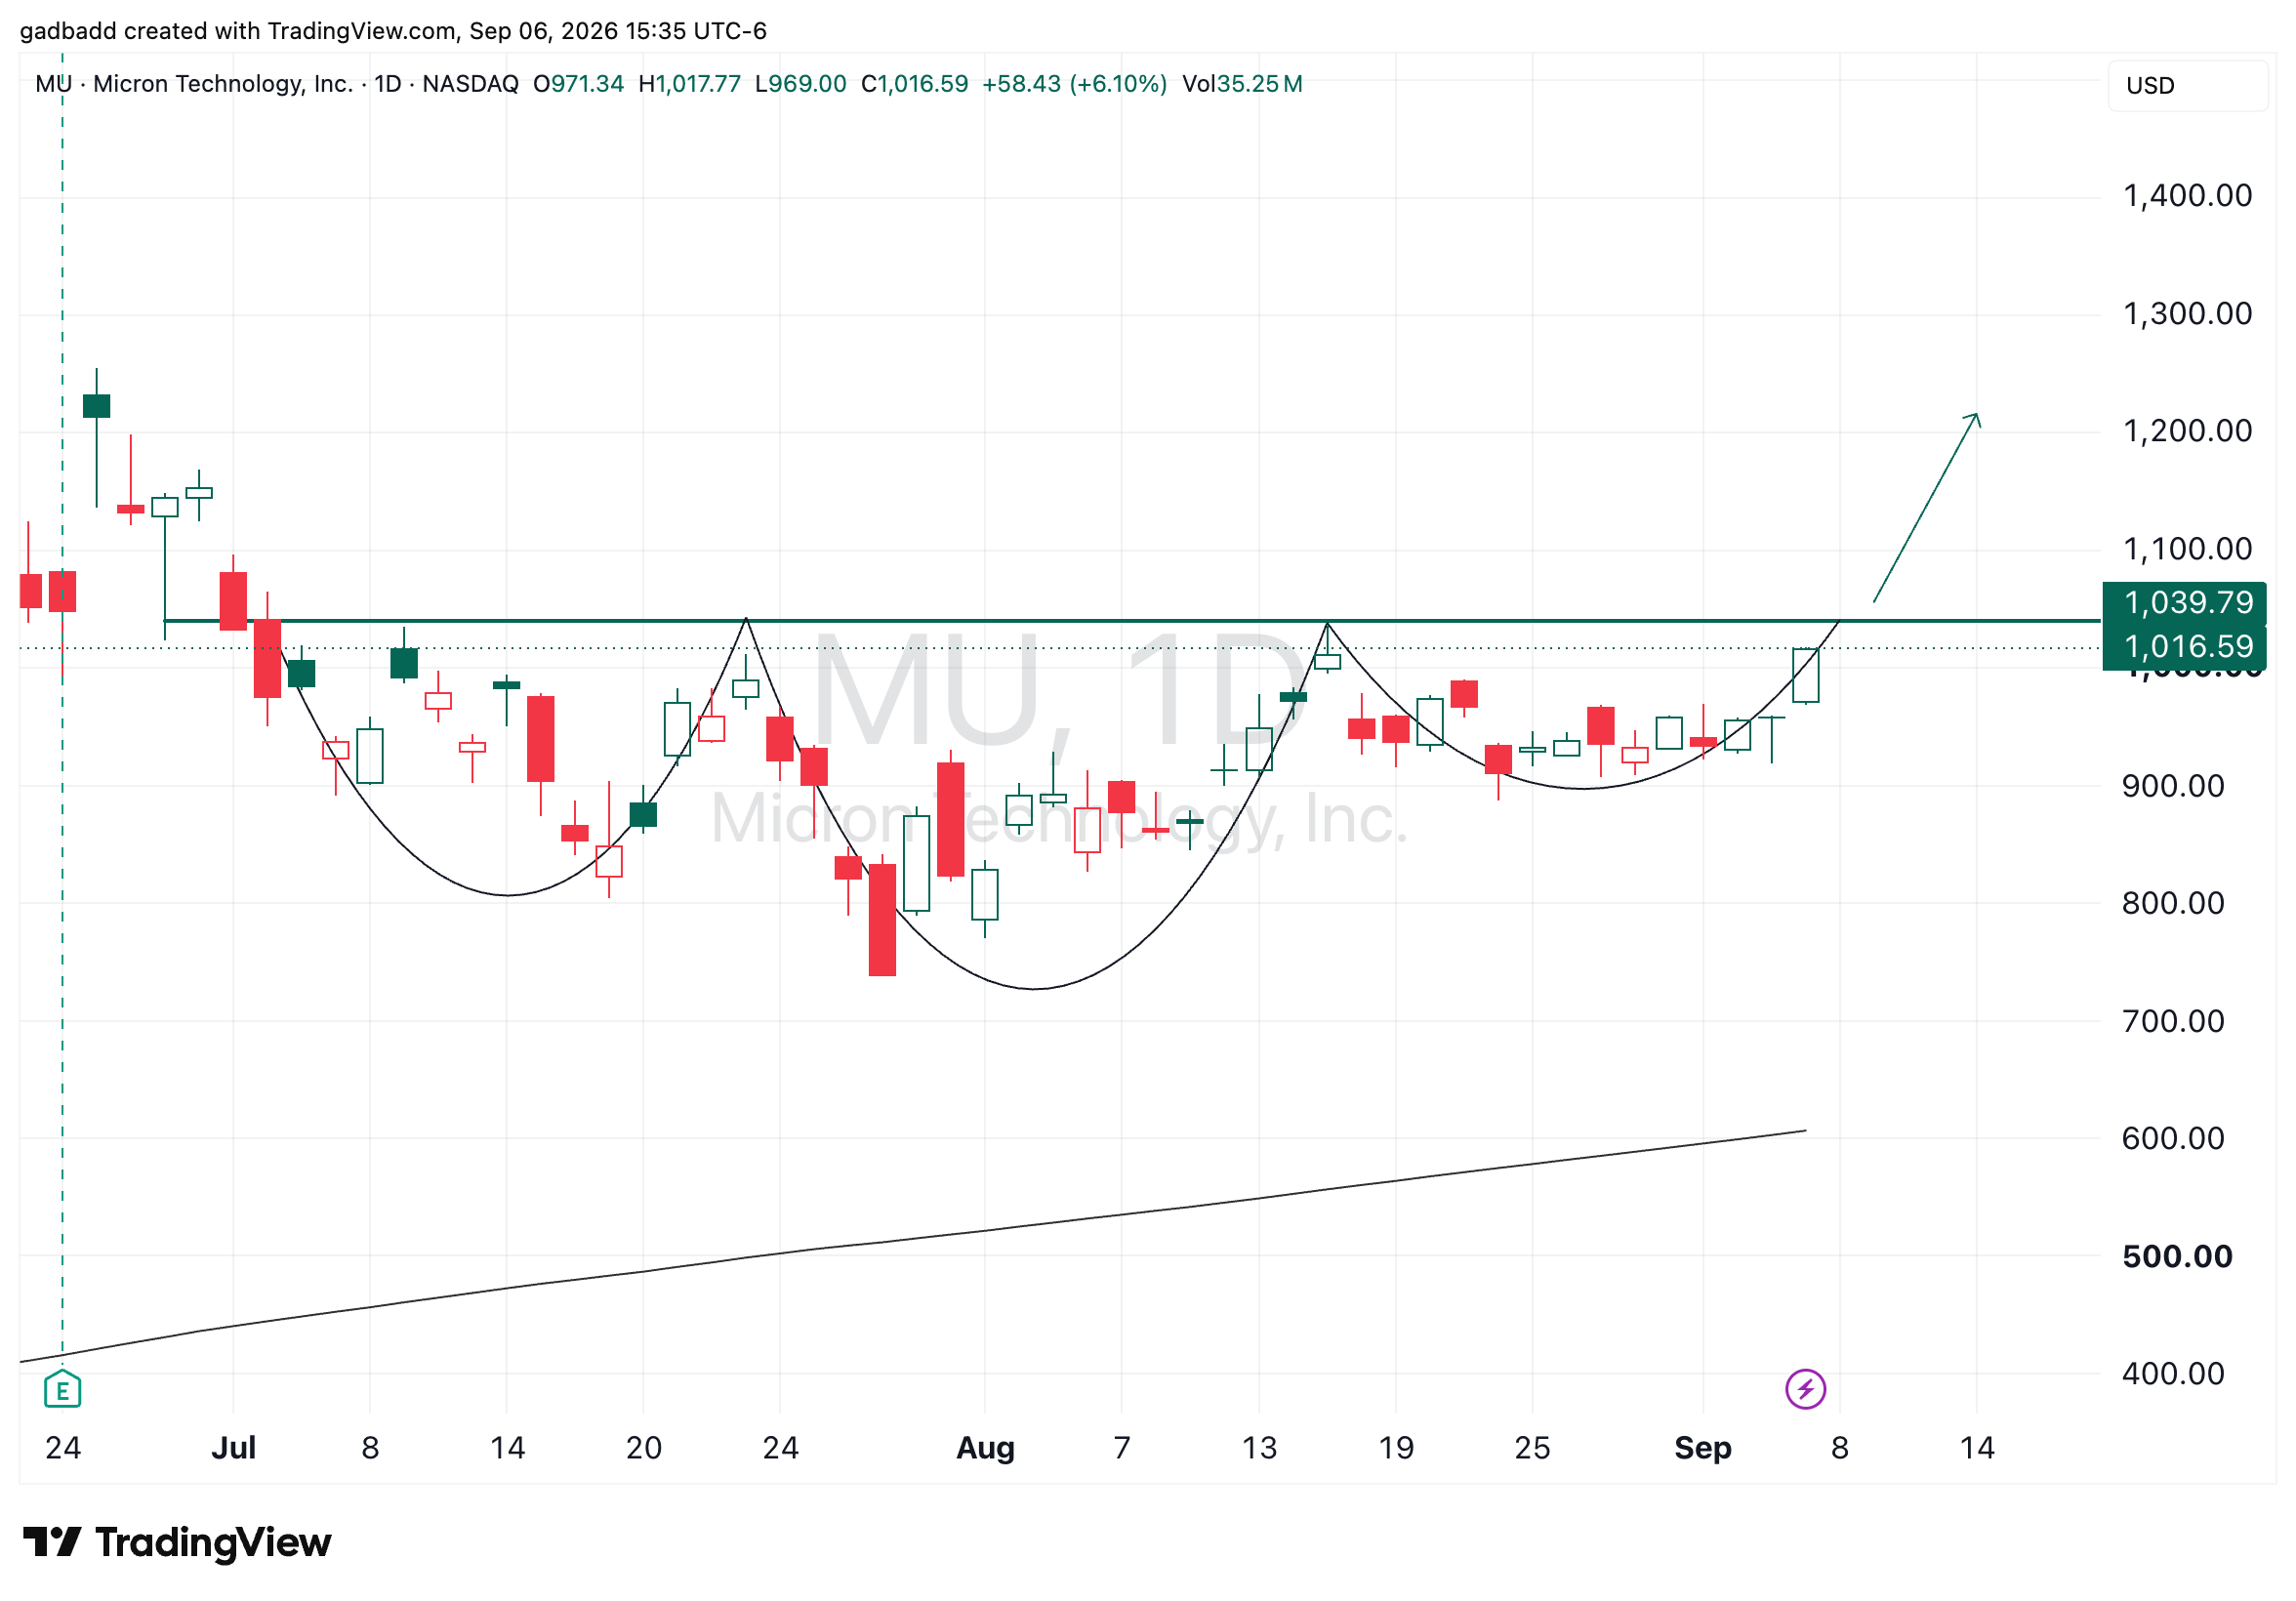
MU daily through September 4, 2026. Micron closed at $1,017, just below resistance near $1,040.
A close below $919 would weaken the setup; a break below the late-August low near $888 would invalidate the base.
The reversal spread across AI infrastructure
The reversal spread beyond chips, and two infrastructure names earned places on the watchlist.
CRWV reclaimed its prior floor and closed near $89. A move above $92 confirms the reversal; below $79 it fails.
NBIS undercut its prior floor, then closed near $226. A move above $231 confirms more strength; below $195 it fails.
Other AI-infrastructure names also rose Friday, strengthening the evidence that the failed breakdown was broader than one stock.
Ranked Watchlist
1. Micron - The cleanest memory-stock expression of the group signal, and I am long MU. Confirmation: a decisive close above $1,040. Weakens below $919; invalid below $888.
2. Nvidia - The semiconductor anchor. Confirmation: a decisive close through $234 to $236, reopening the path toward the all-time high. Weakens below $215; invalid near $190.
3. CoreWeave - Reclaimed its prior floor and closed near $89. Confirmation above $92; invalid below $79.
4. Nebius - Undercut its prior floor and closed near $226. Confirmation above $231; invalid below $195.
Confirmation and the Week Ahead
U.S. markets are closed Monday, September 7, for Labor Day.
Tuesday’s reopening is the first live test of the reversal: I want to see SMH hold $538, DRAM hold its breakout, Micron clear $1,040, Nvidia push through $234 to $236, and CoreWeave and Nebius keep the move broad.
Wednesday shifts the supply chain into focus. Apple’s “Surprise and shine” event begins at 10 a.m. Pacific, with read-through for RF, connectivity, and foundry suppliers.
Thursday combines the rates test with the week’s key AI-infrastructure earnings test: August PPI arrives at 8:30 a.m. Eastern, followed by Oracle’s first-quarter fiscal 2027 results at 5 p.m. Eastern. Friday’s August CPI report, also at 8:30 a.m. Eastern, will help decide whether rates reinforce the move or force consolidation.
The Fed follows the next week, September 15–16, with updated projections. The setup can still produce explosive follow-through, but it does not have to happen in a straight line.
What Could Go Wrong
A rate shock would pressure high-duration and leveraged AI trades, while a catalyst-only bounce could fade as company-specific headlines lose force. With MU and NVDA just below resistance, rejection would leave the market in a range rather than automatically invalidate the larger setup.
The thesis fails if leadership narrows and SMH loses $538, DRAM falls back below $54 to $55, or the stock-specific invalidation levels break.
A Post-Labor-Day Headwind
One historical wrinkle argues for patience on Tuesday. The S&P 500 closed lower on the trading day after Labor Day in each year from 2017 through 2025; those nine observations averaged about -0.93%. That is a headwind to respect, not a forecast.

Bottom Line
The most bullish development this week was not that AI stocks rose. It was that semiconductor leadership refused to break when sellers had the chance.
The SOXX/IGV ratio, the SMH weekly chart and the DRAM breakout say demand is returning at the group level. MU and NVDA are the clearest stock-level tests.
I am positioning for an explosive reversal while the reclaimed levels hold. That means defined entries, size that respects volatility, and immediate respect for the levels that prove the thesis wrong.
Stay constructive. Do not chase.
See More


If this framework helps you navigate the week, subscribe to Inder’s Desk—or share it with one investor trying to separate a real reversal from another bear-market bounce.
Notes
1. COIN and MSTR are historical case studies only. COIN’s horizontal $139 support line to the September 3 high was about 41%; from its August 19 intraday low, about 33%. MSTR rose about 54% from its August 19 low to the September 3 high.
2. The roughly 225% comparison is the SOXX/IGV ratio from the August 2025 test to the June 2026 peak—not SOXX itself. Because it is a relative-strength ratio, both groups can fall while semiconductors fall less.
3. DRAM is Roundhill’s actively managed memory ETF; it does not represent every storage or memory stock. Equity prices and charts are through September 4 unless noted.
4. The post-Labor-Day sample covers nine observations, 2017–2025. The average of the displayed returns is -0.93%. It is a small historical sample, not a predictive signal. The Federal Reserve’s September 2026 calendar lists the FOMC meeting for September 15–16, with the statement and press conference on September 16.
Disclaimer:
This article is for informational and educational purposes only and does not constitute financial, investment, tax, or legal advice. Any opinions, scenarios, price targets, or market observations reflect my personal views and may change without notice. Investing and trading involve substantial risk, including the possible loss of principal. You are solely responsible for your own investment decisions, position sizing, risk management, and trades. Conduct your own research and consult a qualified professional where appropriate.


