



A crash has a shape. It tells you which part of the investment story broke first.
Investors often flatten the dot-com bust into one familiar picture: extreme valuations collided with weak demand, and technology stocks collapsed.
Cisco sits at the center of that story. Whenever a new technology boom starts to look expensive, investors ask whether this is Cisco in 2000 all over again.
The analogy is useful, but incomplete.
Cisco was not the only defining stock of the era. Cisco’s quarterly high rose from $9.37 in fiscal first-quarter 1998 to $80.06 at the March 2000 peak, a gain of roughly 755 percent across 29 months.
Qualcomm produced an even faster ascent, followed by a similarly brutal decline.
Qualcomm’s quarterly high rose from $4.50 in fiscal first-quarter 1998 to $100 in fiscal second-quarter 2000, a gain of roughly 2,125 percent across 24 months.
Both stocks lost almost 90 percent from their peaks. The businesses underneath those declines did not break in the same way.
Cisco’s stock turned down before its reported revenue did. Qualcomm’s stock outran a company whose financial statements were being reshaped by divestitures, investment losses and large non-operating charges.
One crash exposed a delayed operating collapse. The other exposed how easily a changing business can be misread through consolidated revenue and net income.
Put them together and the dot-com bust stops looking like one script. It becomes a framework for recognizing different shapes of risk. The two charts below place stock price, revenue and net income on the same timeline, making it easier to see which part of each investment story moved first.
To be clear, this is not a prediction that an AI crash is imminent. It is a learning exercise in how to recognize one when it comes, without assuming every selloff has the same cause.
Cisco: the price peak came first
On March 27, 2000, Cisco closed at $80.06 a share. Its market value reached roughly $555 billion, briefly putting it ahead of Microsoft as the world’s most valuable public company.
That was not the end of Cisco’s reported growth.
Cisco generated $4.93 billion of revenue in fiscal third-quarter 2000, the quarter containing the stock-market peak. Revenue then rose to $5.72 billion, $6.52 billion and finally $6.75 billion in fiscal second-quarter 2001.
Quarterly revenue climbed another 37 percent after the quarter containing the stock peak.
The market had started discounting something the income statement had not yet shown.
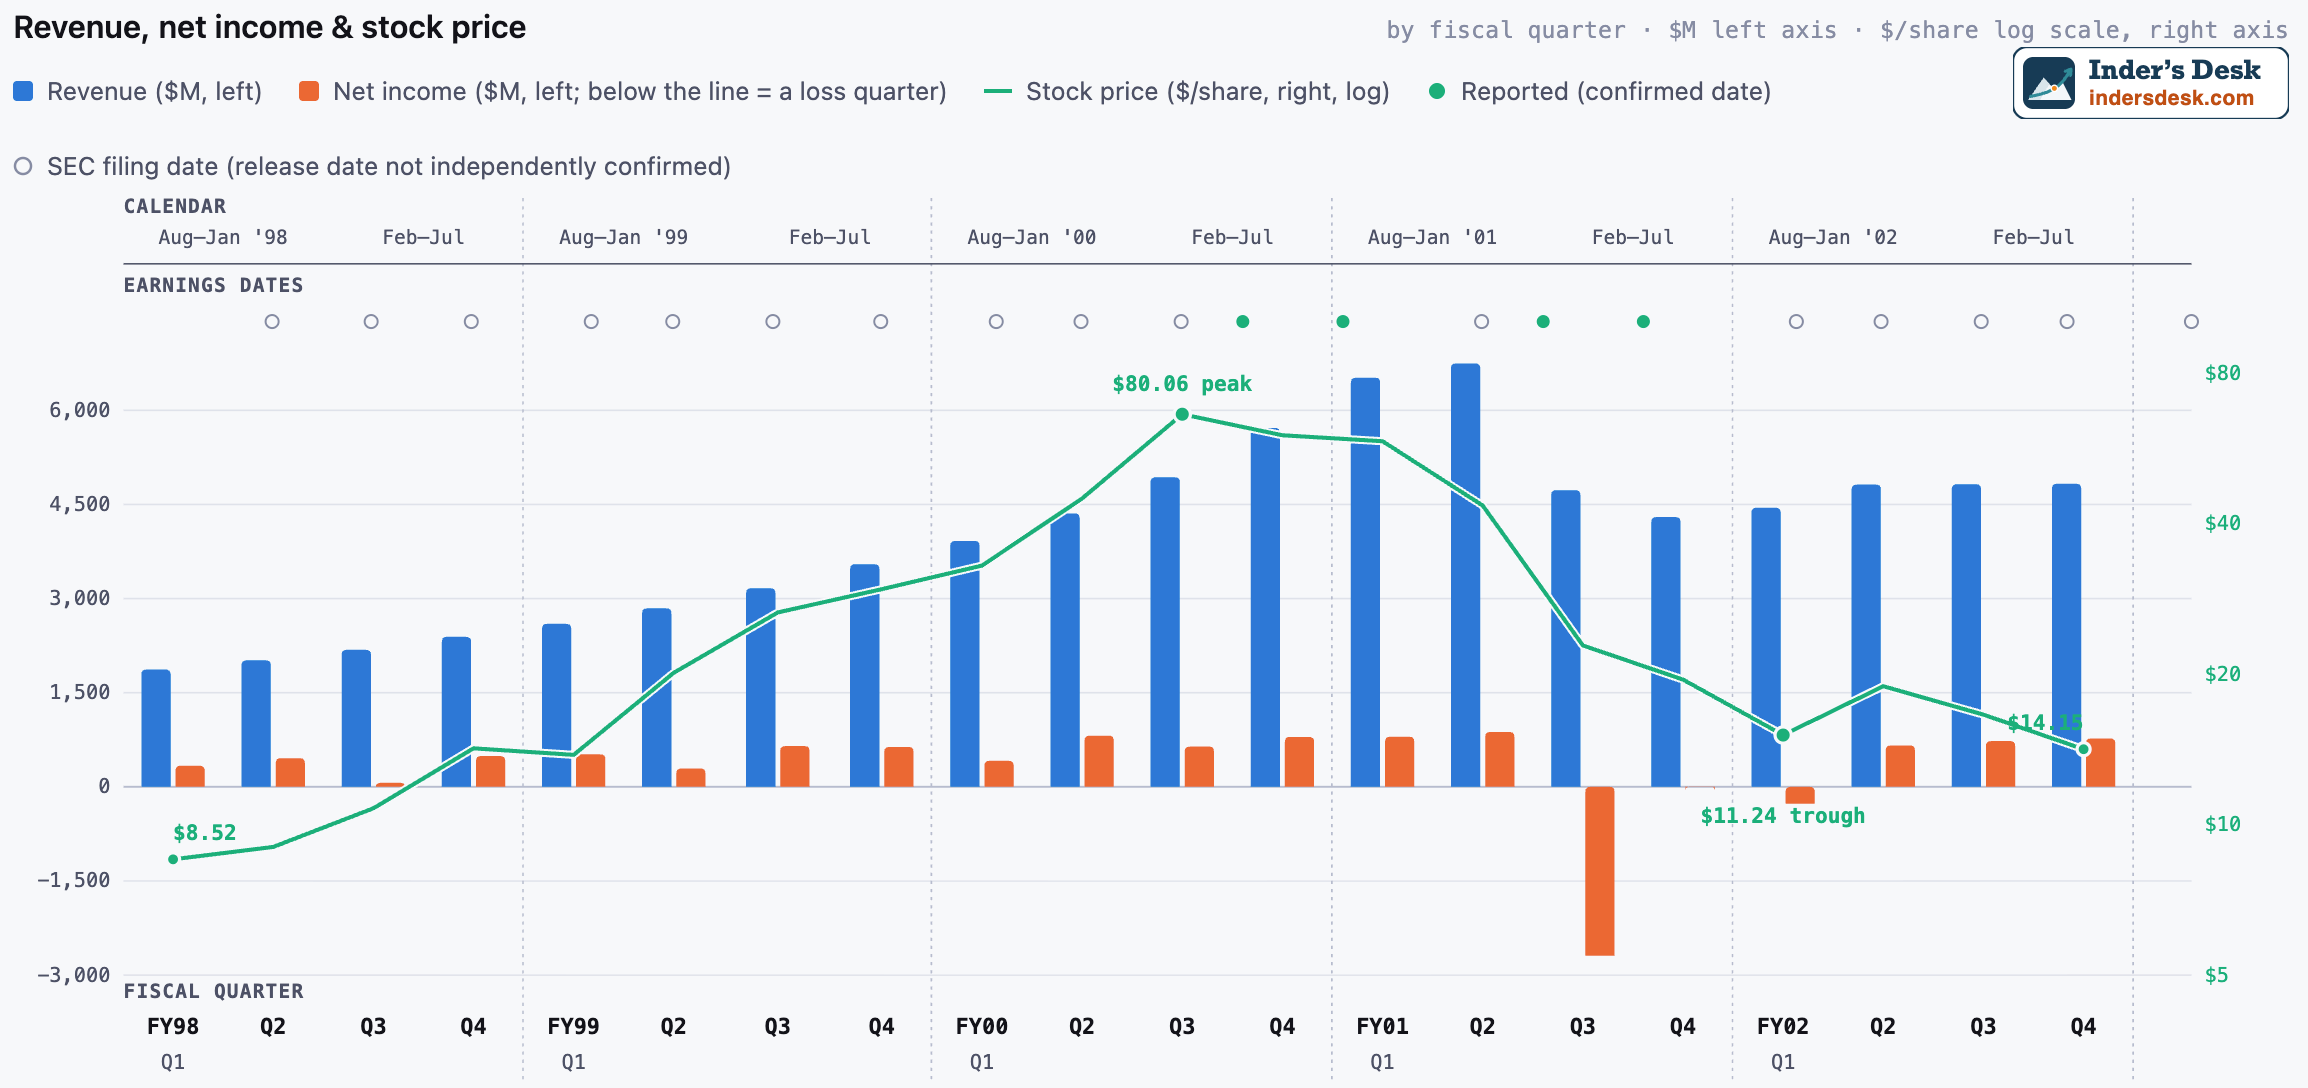
Cisco’s stock peaked before quarterly revenue did. Revenue and net income are shown as bars; the stock line connects the midpoint of each quarterly high-low range.
The operating break arrived in fiscal third-quarter 2001.
Revenue fell 30 percent from the previous quarter to $4.73 billion. Cisco reported a $2.69 billion net loss, including a $2.25 billion inventory charge and approximately $1.17 billion of restructuring costs.
The sequence is what makes Cisco a useful warning.
The valuation reset did not wait for reported revenue to peak.
By the time the operating collapse became undeniable, the stock had already fallen sharply from its high.
As is often said in investing, price can lead fundamentals—markets may begin discounting deterioration before it appears in reported results.
Investors watching only the revenue line would have received the signal late. The more important changes were happening underneath it: customer demand, order cancellations, excess inventory and the financing environment for telecom and dot-com customers.
Cisco’s revenue subsequently stabilized at roughly $4.4 billion to $4.8 billion per quarter, and the company returned to profitability. But the valuation regime had changed, and the stock took more than 25 years—from March 2000 to December 2025—to surpass its dot-com-era closing high.
Qualcomm: the accounting story was messier
Qualcomm looks similar from a distance.
Its fully split-adjusted stock price reached $100 during fiscal second-quarter 2000. It later fell to a post-peak quarterly low of $11.61 in fiscal fourth-quarter 2002, a decline of about 88 percent.
But the business path underneath that decline was not Cisco’s.
Qualcomm’s reported quarterly revenue peaked at $1.12 billion in fiscal first-quarter 2000, then fell as the company exited its infrastructure and handset businesses. Qualcomm closed the sale of its terrestrial wireless infrastructure business to Ericsson in 1999 and sold its handset business to Kyocera in 2000.
The lower consolidated revenue base therefore reflected both operating conditions and a deliberate change in what the company owned.
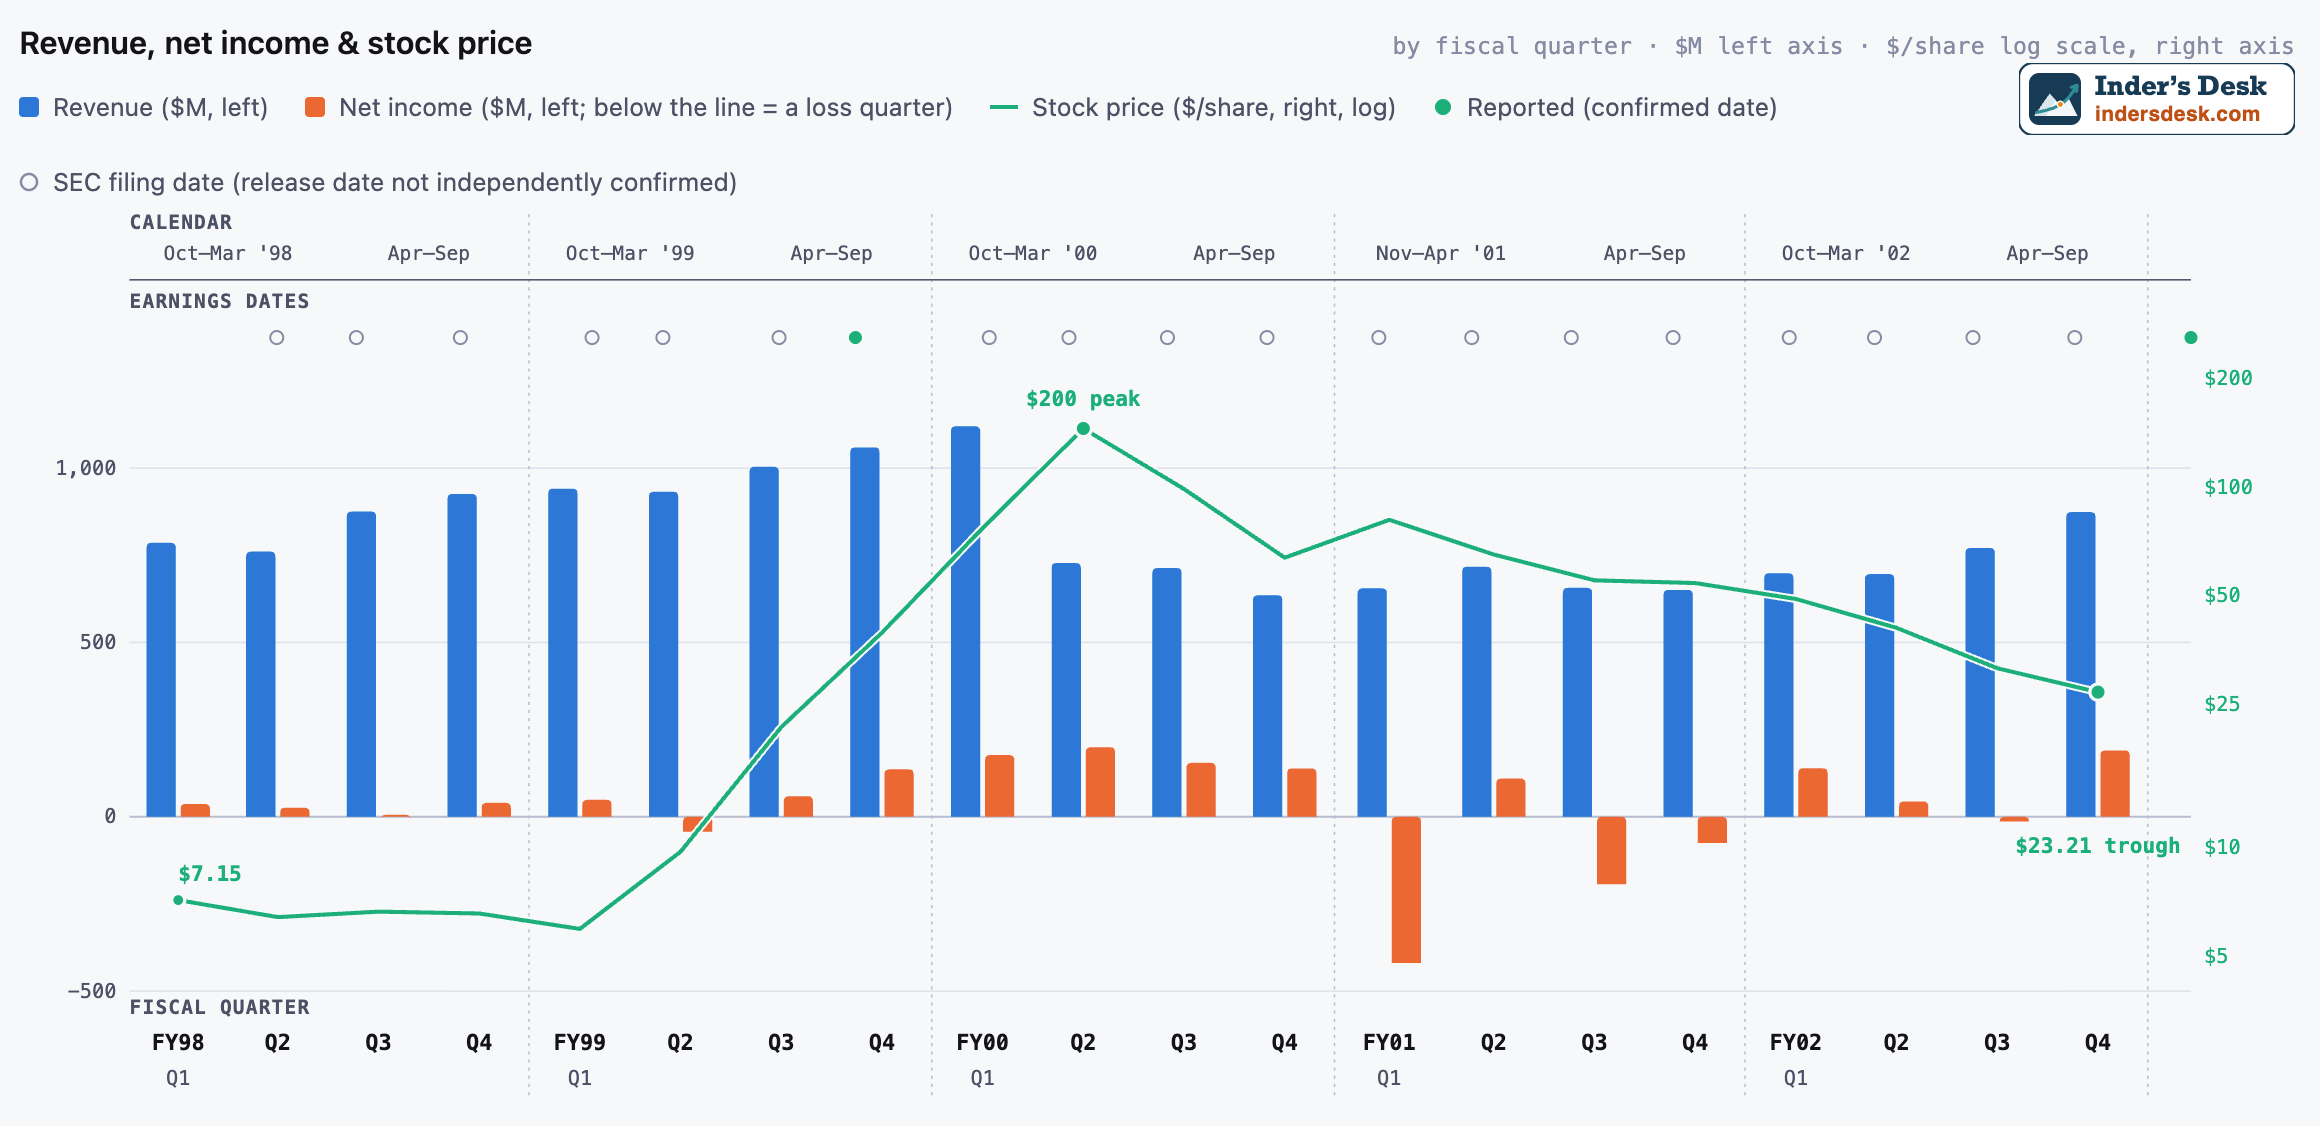
Qualcomm’s valuation collapsed while divestitures changed the reported revenue base and non-operating charges made net income unusually volatile.
The earnings record was also far more volatile than the top line alone suggests. Quarterly net income ranged from a $199.7 million profit to a $419.2 million loss during the period shown.
Fiscal 2001 is the clearest example.
Qualcomm reported positive operating income in three of the year’s four quarters, but positive net income in only one. The gap reflected more than the performance of its day-to-day operations. Qualcomm recorded major Globalstar-related impairments, net investment losses and charges tied to strategic initiatives.
That does not make the stock decline irrational. It changes the diagnosis.
Qualcomm was not simply a stable business whose shares detached from reality. Nor was it experiencing the same clean operating collapse as Cisco. It was undergoing an extraordinary valuation reset while changing its business mix and absorbing losses outside its core licensing and chipset operations.
Same crash, different warning
The two companies reveal different failure modes.
Cisco shows why waiting for reported revenue to roll over can be dangerous. Orders, inventories and customer financing conditions can deteriorate before the headline growth rate turns negative. The stock price may react months before the deterioration becomes obvious in reported results.
Qualcomm shows why consolidated revenue and net income can become misleading when the corporate perimeter is changing. Divestitures can make the top line shrink even as continuing businesses improve. Investment losses and impairments can overwhelm operating profit without proving that the core franchise has stopped working.
The charts make those different timelines visible. In Cisco’s chart, the stock-price line turns down before the revenue bars peak. In Qualcomm’s chart, the valuation collapses while divestitures and non-operating charges complicate the reported fundamentals.
The more useful question for AI investors
The wrong question is whether today’s AI market is destined to repeat Cisco in 2000. This exercise is about recognition, not prediction.
The more useful questions are specific:
- Is customer demand being pulled forward faster than end-market usage?
- Are order commitments, channel inventories or financing terms hiding a change in demand?
- Is reported growth coming from a durable operating engine or a temporary accounting effect?
- Is the company changing its business mix in a way that makes simple year-over-year comparisons unreliable?
- Which indicator would turn before revenue if underlying demand started weakening?
- What must go right for today’s valuation to be earned?
Historical analogies are most useful when they produce better questions, not automatic forecasts.
Cisco and Qualcomm both lost almost 90 percent from their peaks. That superficial similarity can obscure the most important part of the story: the operating evidence underneath each decline was different.
The next major technology correction is unlikely to follow one script either.
Bottom Line
- Cisco’s quarterly revenue continued rising for three reported quarters after the quarter containing its March 2000 stock peak.
- Cisco’s operating break became undeniable in fiscal third-quarter 2001, when revenue fell 30 percent sequentially and the company reported a $2.69 billion net loss.
- Qualcomm’s reported revenue decline was partly structural because it sold its infrastructure and handset businesses.
- Qualcomm’s fiscal 2001 net losses were not a clean proxy for its core operations. Operating income was positive in three of four quarters, while investment losses, impairments and strategic charges weighed on net income.
- The useful lesson is not that every AI stock will repeat Cisco or Qualcomm. It is that price, reported growth and underlying business quality can turn on different timelines.
- Investors need to identify the operating signal that matters for each company before the headline numbers weaken.
The lesson is not to predict the date of the next crash. It is to recognize what price, reported results and the underlying business are saying when they stop moving together. If this kind of evidence-first technology research is useful, subscribe to Inder’s Desk. If you already subscribe, sharing this article with one investor who follows the AI cycle is the most helpful way to support the work.
Sources
Cisco’s fiscal 2000 annual filing (https://www.sec.gov/Archives/edgar/data/858877/000109581100003692/0001095811-00-003692-index.html), Cisco’s fiscal 2001 annual filing (https://www.sec.gov/Archives/edgar/data/858877/000109581101505065/0001095811-01-505065-index.html), Cisco’s fiscal 2002 annual report (https://www.sec.gov/Archives/edgar/data/858877/000089161802004345/f84358exv13.htm), contemporary reporting on Cisco’s March 2000 market value (https://www.latimes.com/archives/la-xpm-2000-mar-28-mn-13512-story.html), Qualcomm’s fiscal 2000 annual filing (https://www.sec.gov/Archives/edgar/data/804328/000091205700047095/0000912057-00-047095-index.htm), Qualcomm’s fiscal 2001 annual filing (https://www.sec.gov/Archives/edgar/data/804328/000093639201500225/a76829e10-k.htm), Qualcomm’s fiscal 2002 annual filing (https://www.sec.gov/Archives/edgar/data/804328/000093639202001489/a85543e10vk.htm), Qualcomm’s Ericsson transaction announcement (https://www.qualcomm.com/news/releases/1999/05/qualcomm-and-ericsson-close-agreements) and Qualcomm’s official stock-split history (https://investor.qualcomm.com/stock-info/dividend-split-history/default.aspx).
Data note: Financial results and quarterly high-low stock-price ranges are transcribed from the companies’ annual reports. Cisco prices reflect the stock splits shown in its filings. Qualcomm prices have also been adjusted for the August 2004 two-for-one split so the full series uses one consistent share basis. Quarterly ranges identify the high and low within each fiscal quarter, not the exact trading date of either extreme.
Disclaimer:
This article is for informational and educational purposes only and does not constitute financial, investment, tax, or legal advice. Any opinions, scenarios, price targets, or market observations reflect my personal views and may change without notice. Investing and trading involve substantial risk, including the possible loss of principal. You are solely responsible for your own investment decisions, position sizing, risk management, and trades. Conduct your own research and consult a qualified professional where appropriate.


