


This market is at a decision point. QQQ and semiconductors strengthened on Friday while washed-out breadth showed a faint recovery. Yet softer labor numbers failed to deliver lasting relief in long-term yields, and the dollar broke higher Sunday night.
I’m not confident about which direction this resolves. I’ll wait for price to give me a direction before making fresh commitments.
What this episode answers
Can QQQ and SOXX hold their breakouts and bring other sectors with them?
What does Friday’s faint breadth recovery need to become sustained repair?
Why do rising yields and dollar strength still deserve attention after softer jobs data?
Friday gave buyers something to build on
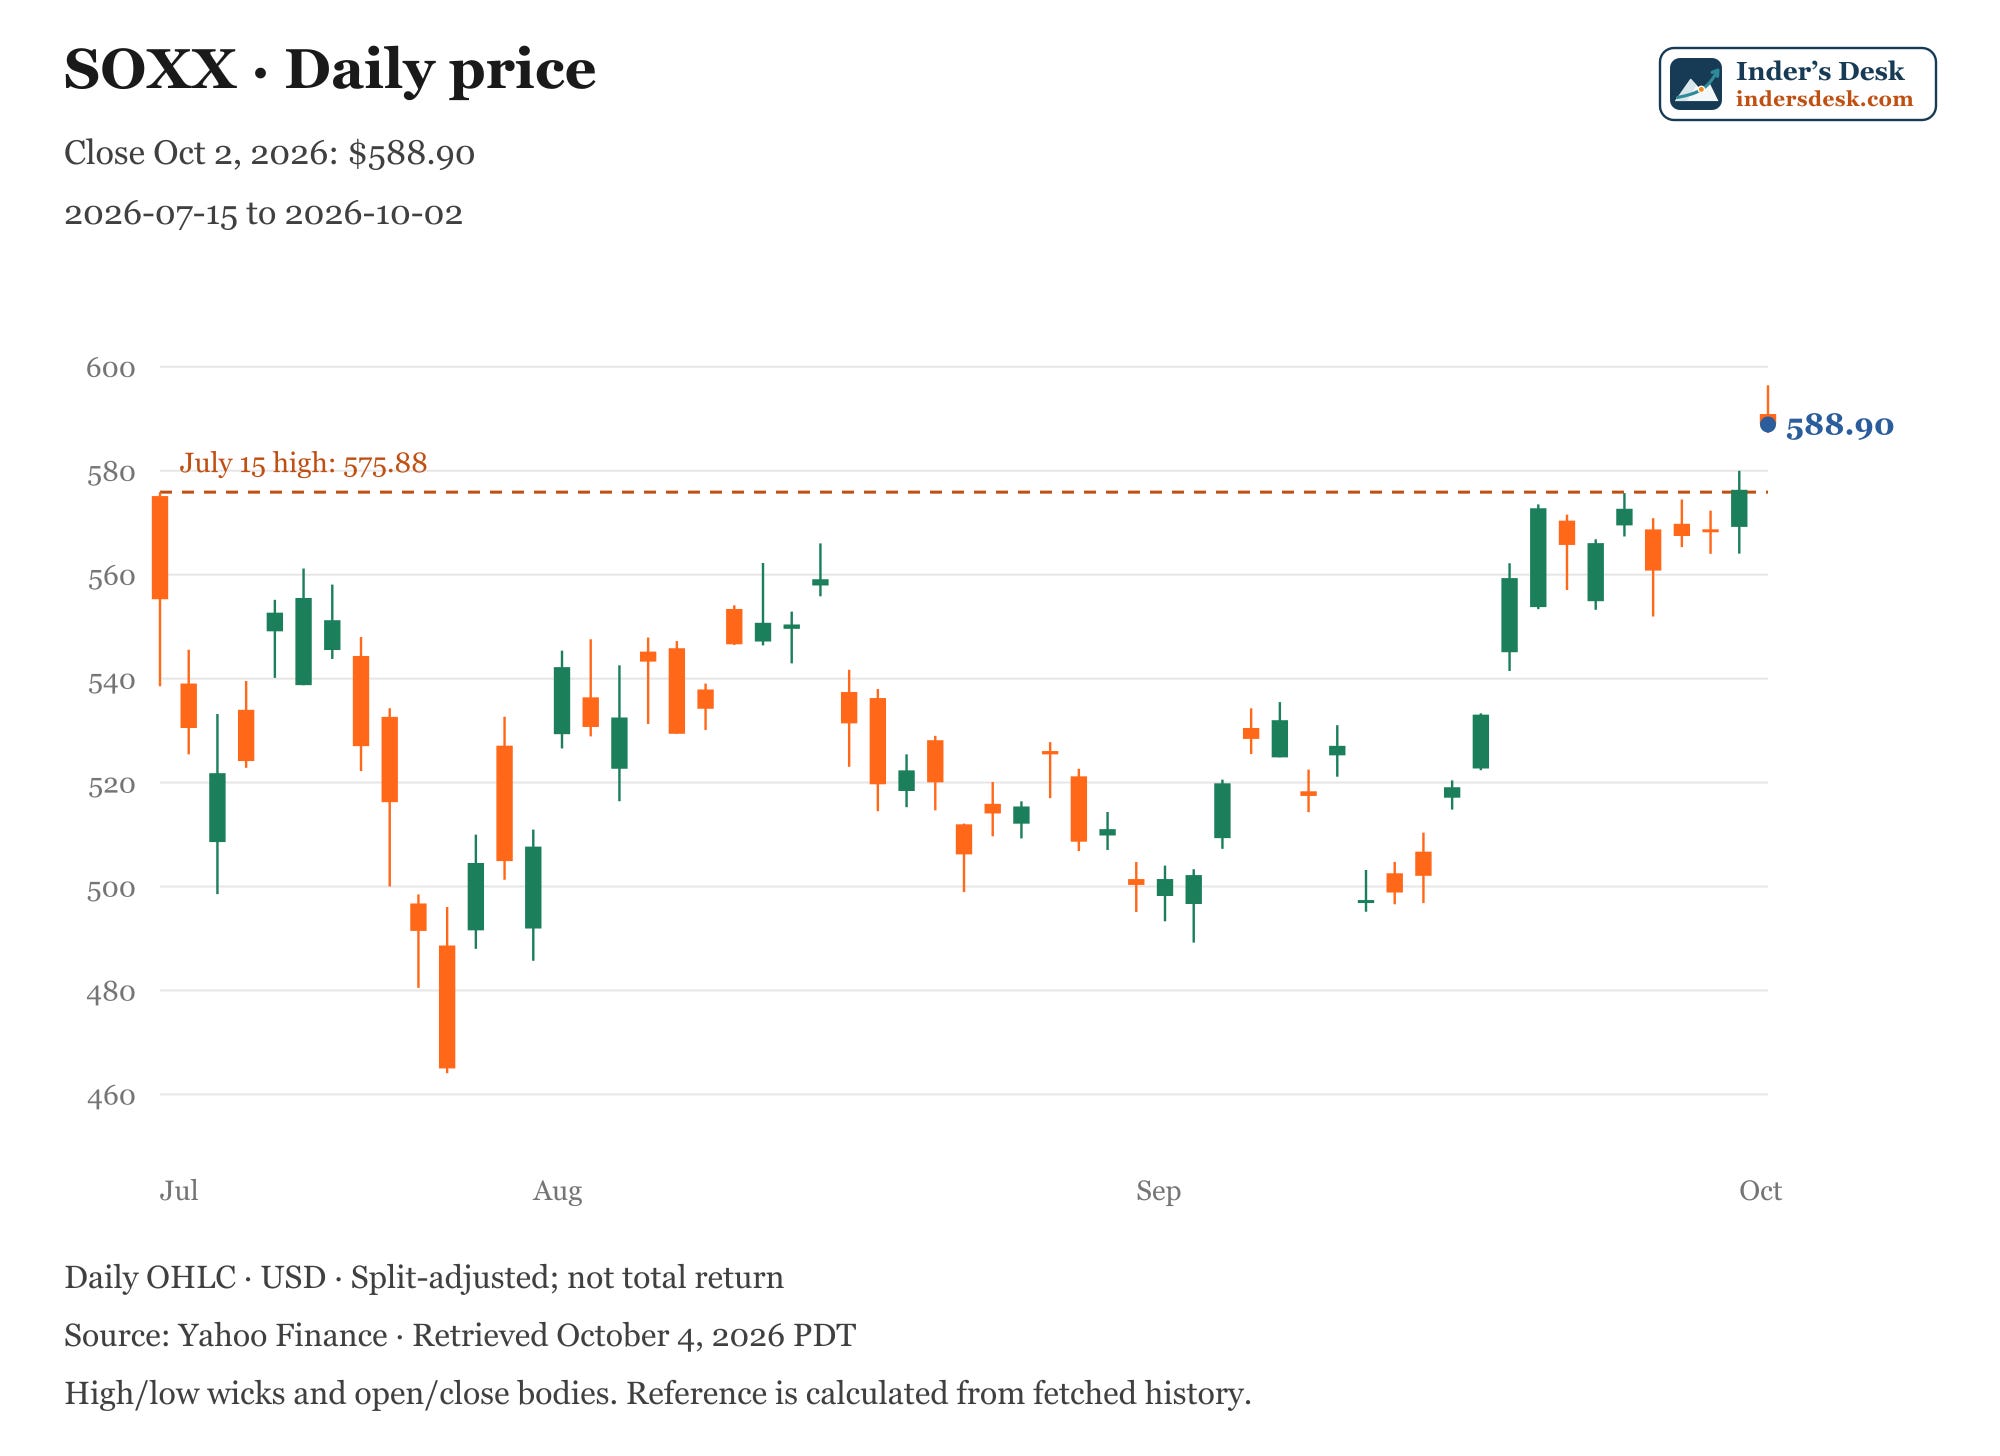
SOXX broke out on October 2 above the marked $575.88 resistance. Friday’s close was $588.90. The new chart marks the July 15 high at $575.88. The test now is whether buyers defend the former ceiling on a pullback.
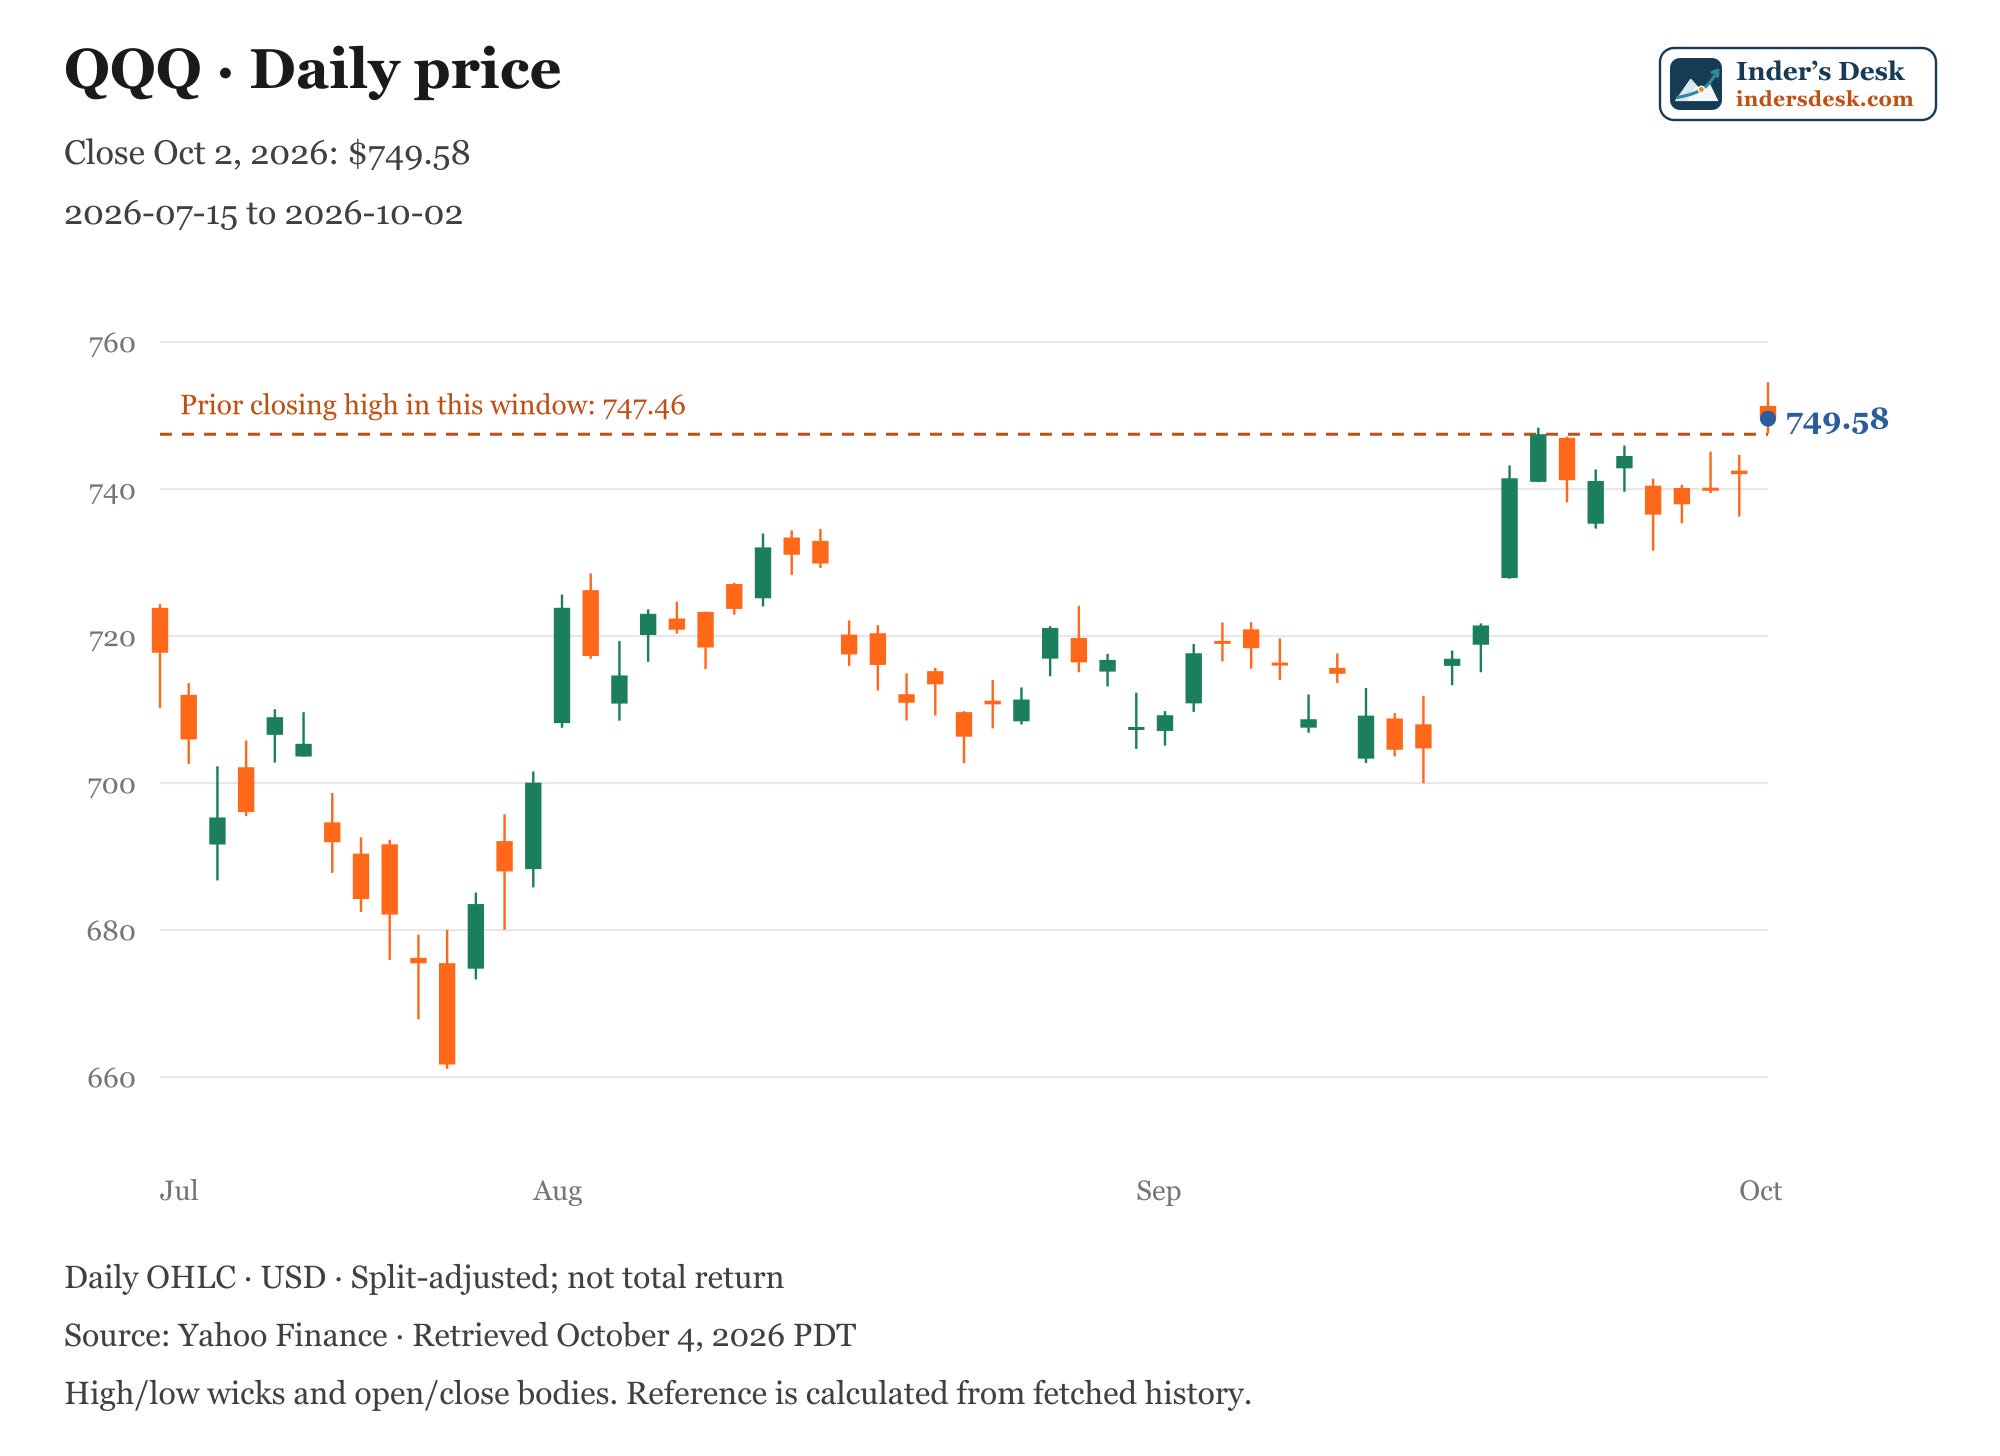
QQQ closed Friday at $749.58, above the previous closing high of $747.46 in the new chart’s July 15–October 2 window. The closing breakout remains intact.
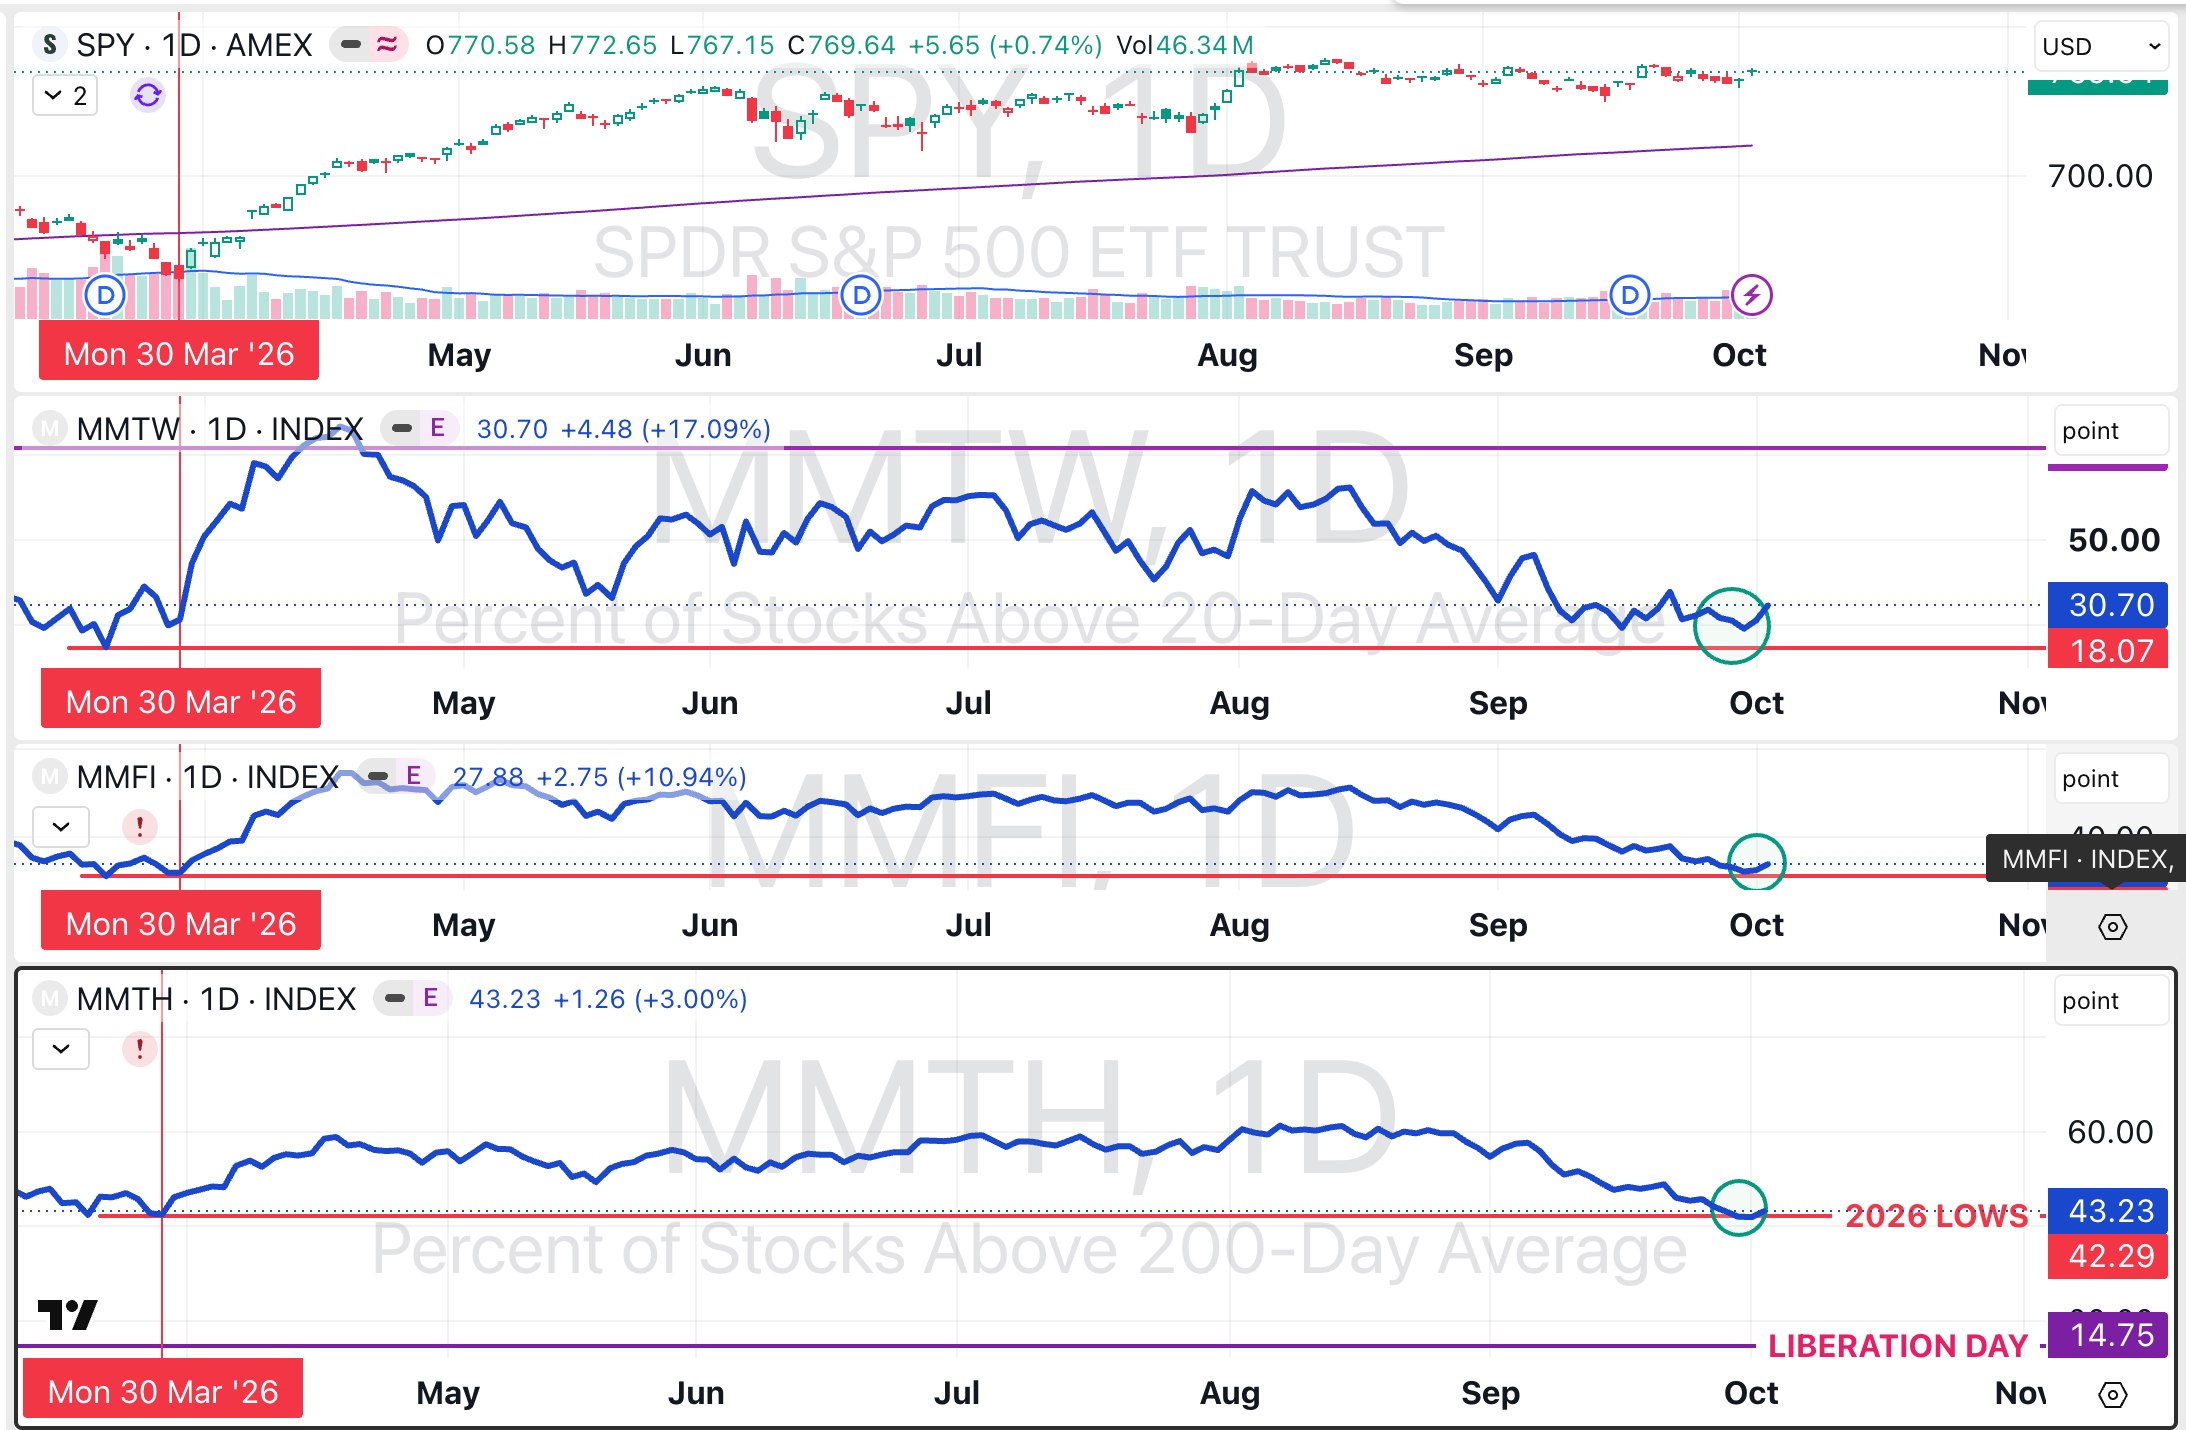
Breadth remains weak. The chart in my Sunday Note shows 30.70% above the 20-day average, 27.88% above the 50-day and 43.23% above the 200-day. Friday’s gains were 4.48, 2.75 and 1.26 percentage points respectively. These are the chart’s breadth series, not an assumed count of QQQ or S&P 500 constituents.
Softer jobs, persistent rate pressure
The October 2 BLS release reported 29,000 September jobs, 4.2% unemployment and a combined 60,000 downward revision to July and August. The St. Louis Fed’s review described payroll gains as less than half forecasts.
Yields initially fell, then the 10-year reversed and ended Friday higher. The dollar initially weakened too; its Sunday-night breakout is a separate observation. We should not confuse the first reaction with the later move or infer a single cause from the charts.
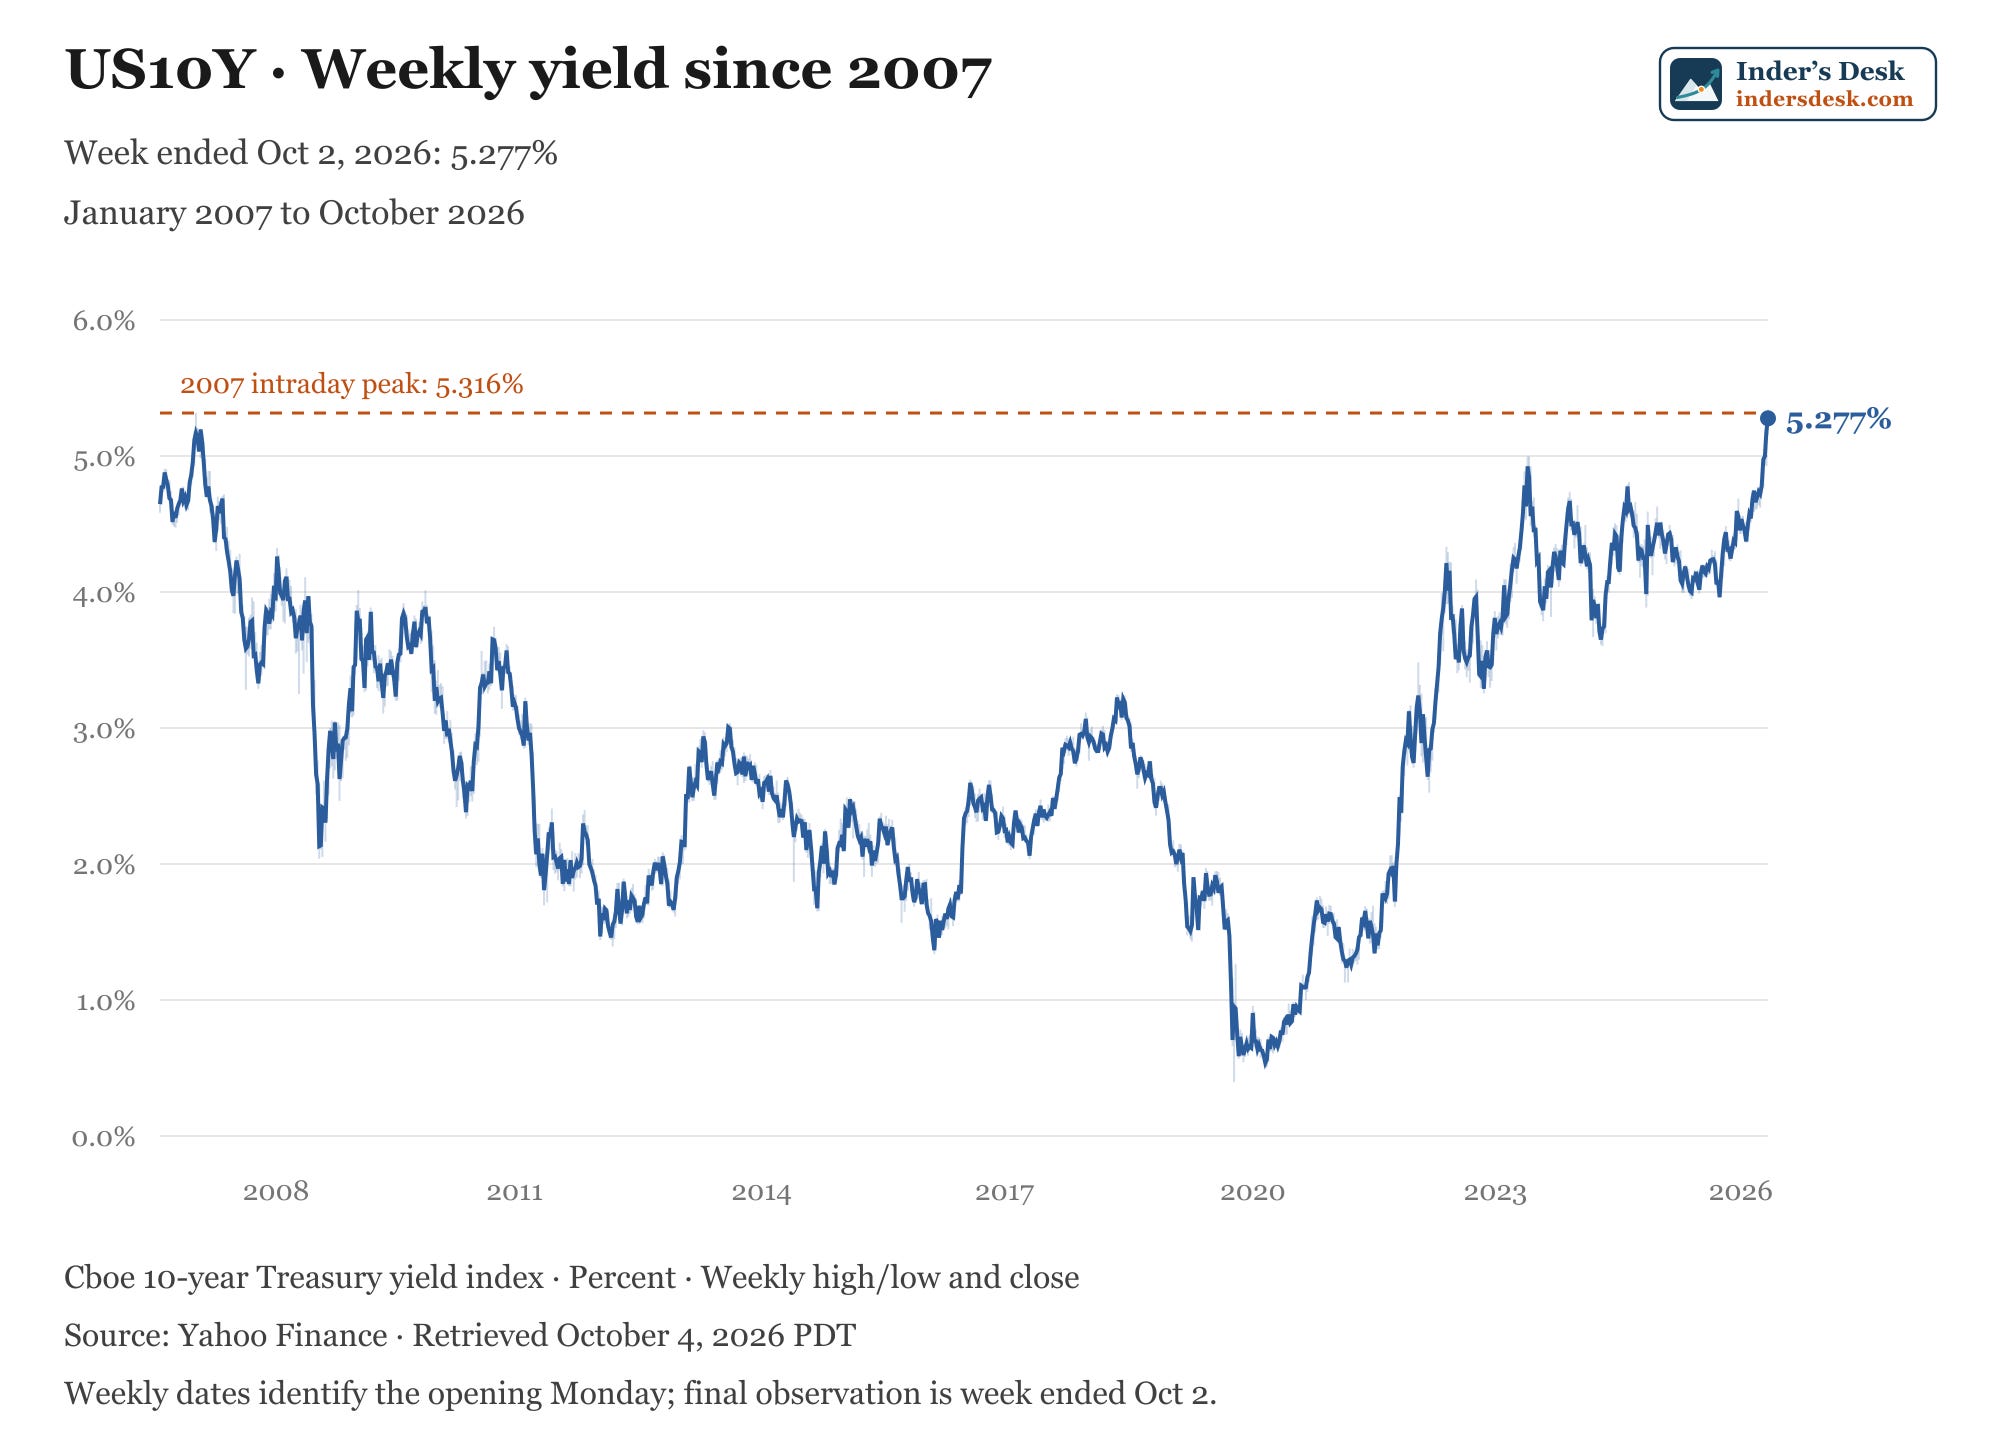
The new weekly US10Y chart spans 2007 to October 2026. The Cboe 10-year yield index ended the week at 5.277%, near its 2007 intraday peak of 5.316%. Weekly highs and lows are shown behind the closing line.
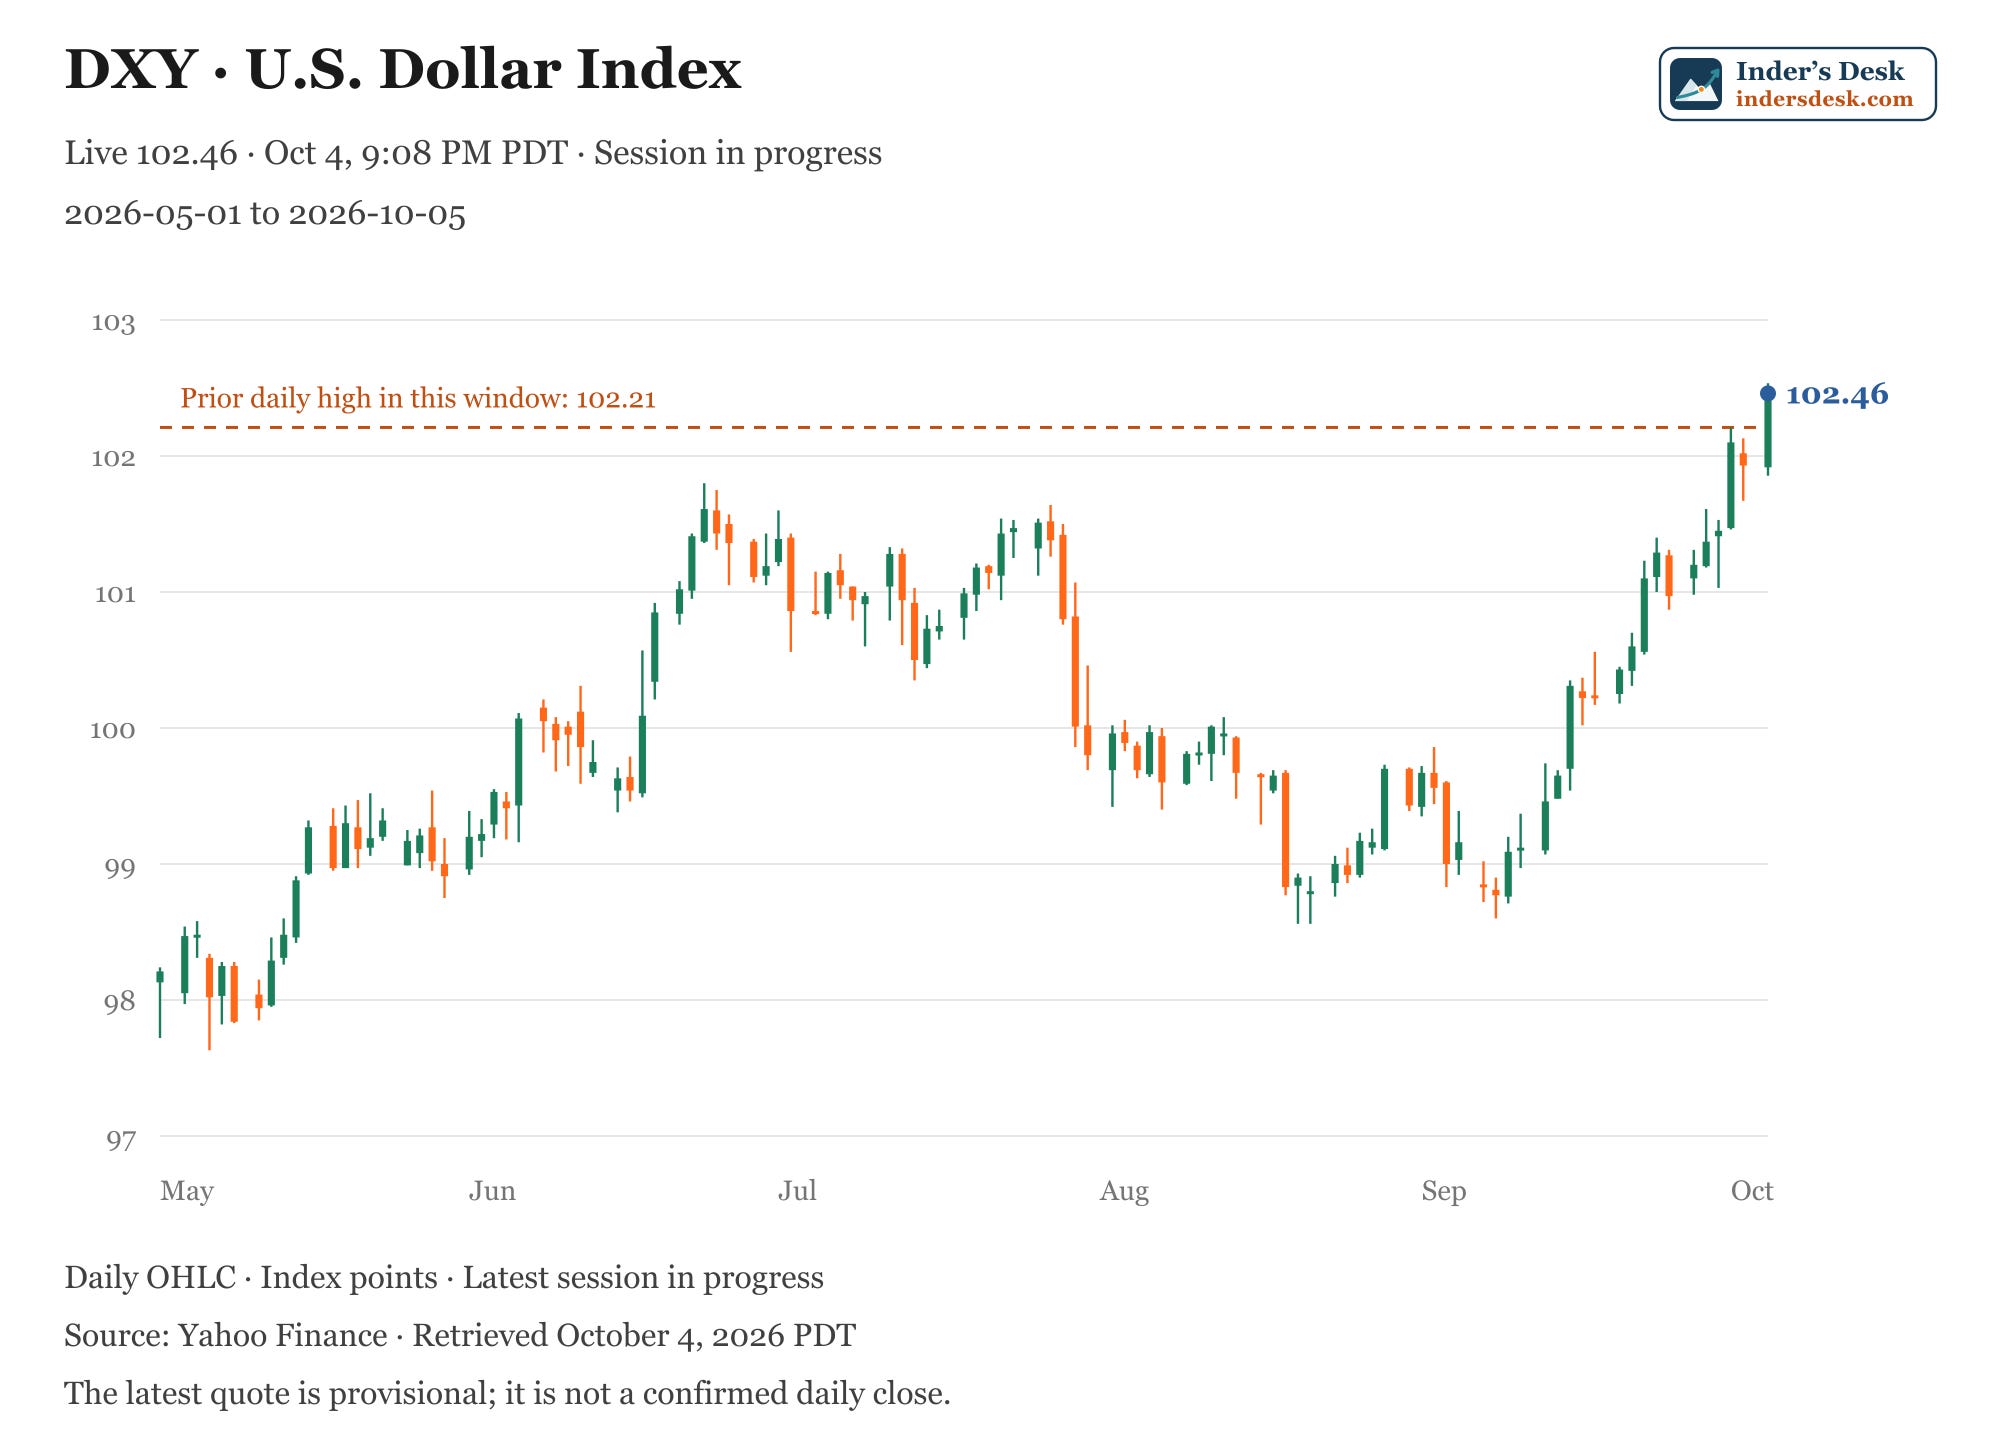
DXY traded at 102.46 Sunday night, above the prior daily high of 102.21 in the new chart’s May-to-October window. The October 5 session is still in progress; this is not a confirmed daily close.
What the Fed itself projected
The September 16 statement raised the target range by 25 basis points to 3.75%–4.00%, citing elevated inflation. In the official projections, 16 of 18 participants placed year-end rates above the current midpoint. The median, 4.125%, implied another quarter-point increase by year-end.
Those are individual policy judgments, not a promise of an October hike. They also predate Friday’s labor report. The 10-year yield is a market rate, distinct from the Fed’s policy target.
Let price resolve the decision
Continuation: QQQ and SOXX hold their breakouts, and improving participation spreads to other groups.
Failure: leaders lose their breakouts and cannot reclaim them while breadth gives back Friday’s improvement and deteriorates.
Still unresolved: price churns near the breakout levels and participation stays mixed. There is no need to force a forecast.
One dip below a line is not a complete market breakdown. I want sustained evidence in both price and participation.
My stance: wait for price to give me direction. That means holding off on fresh commitments; it is not a blanket instruction to liquidate existing positions.
Subscribe to Inder’s Desk for the follow-up research. Already subscribed? Share this episode with one investor working through the same decision.
Price charts use independently fetched Yahoo Finance history. The narration refers to earlier snapshots and marked levels, including QQQ $749.22, DXY 101.974 and US10Y 5.286%; these differ from the references calculated from the new feed. The breadth chart remains from my Sunday Note. Friday’s QQQ close is corroborated by historical data. The Friday closing report documents the yield reversal; Reuters’ initial-reaction report records the early dollar decline.
Disclaimer:
This article is for informational and educational purposes only and does not constitute financial, investment, tax, or legal advice. Any opinions, scenarios, price targets, or market observations reflect my personal views and may change without notice. Investing and trading involve substantial risk, including the possible loss of principal. You are solely responsible for your own investment decisions, position sizing, risk management, and trades. Conduct your own research and consult a qualified professional where appropriate.


