




September is not finished. With two trading days remaining, the S&P 500 is roughly flat for the month and QQQ is up 2.76% through the September 28 close. Both have held up better than the seasonal average from our earlier research.
That is the starting point for October: QQQ has shown resilience, while the broader index has made little progress.
September so far
In our September seasonality study, we highlighted weakness in the final stretch of the month. The comparison below uses the same six midterm years from 2002 through 2022, rebuilt as month-to-date returns.
This September has been uneven. Both benchmarks fell into midmonth before recovering. QQQ retained more of that rebound despite Monday’s decline.
Through September 28, SPX is down 0.03%, compared with a historical average decline of 0.69% at the same calendar date. QQQ’s 2.76% gain compares with a seasonal average gain of 0.24%.
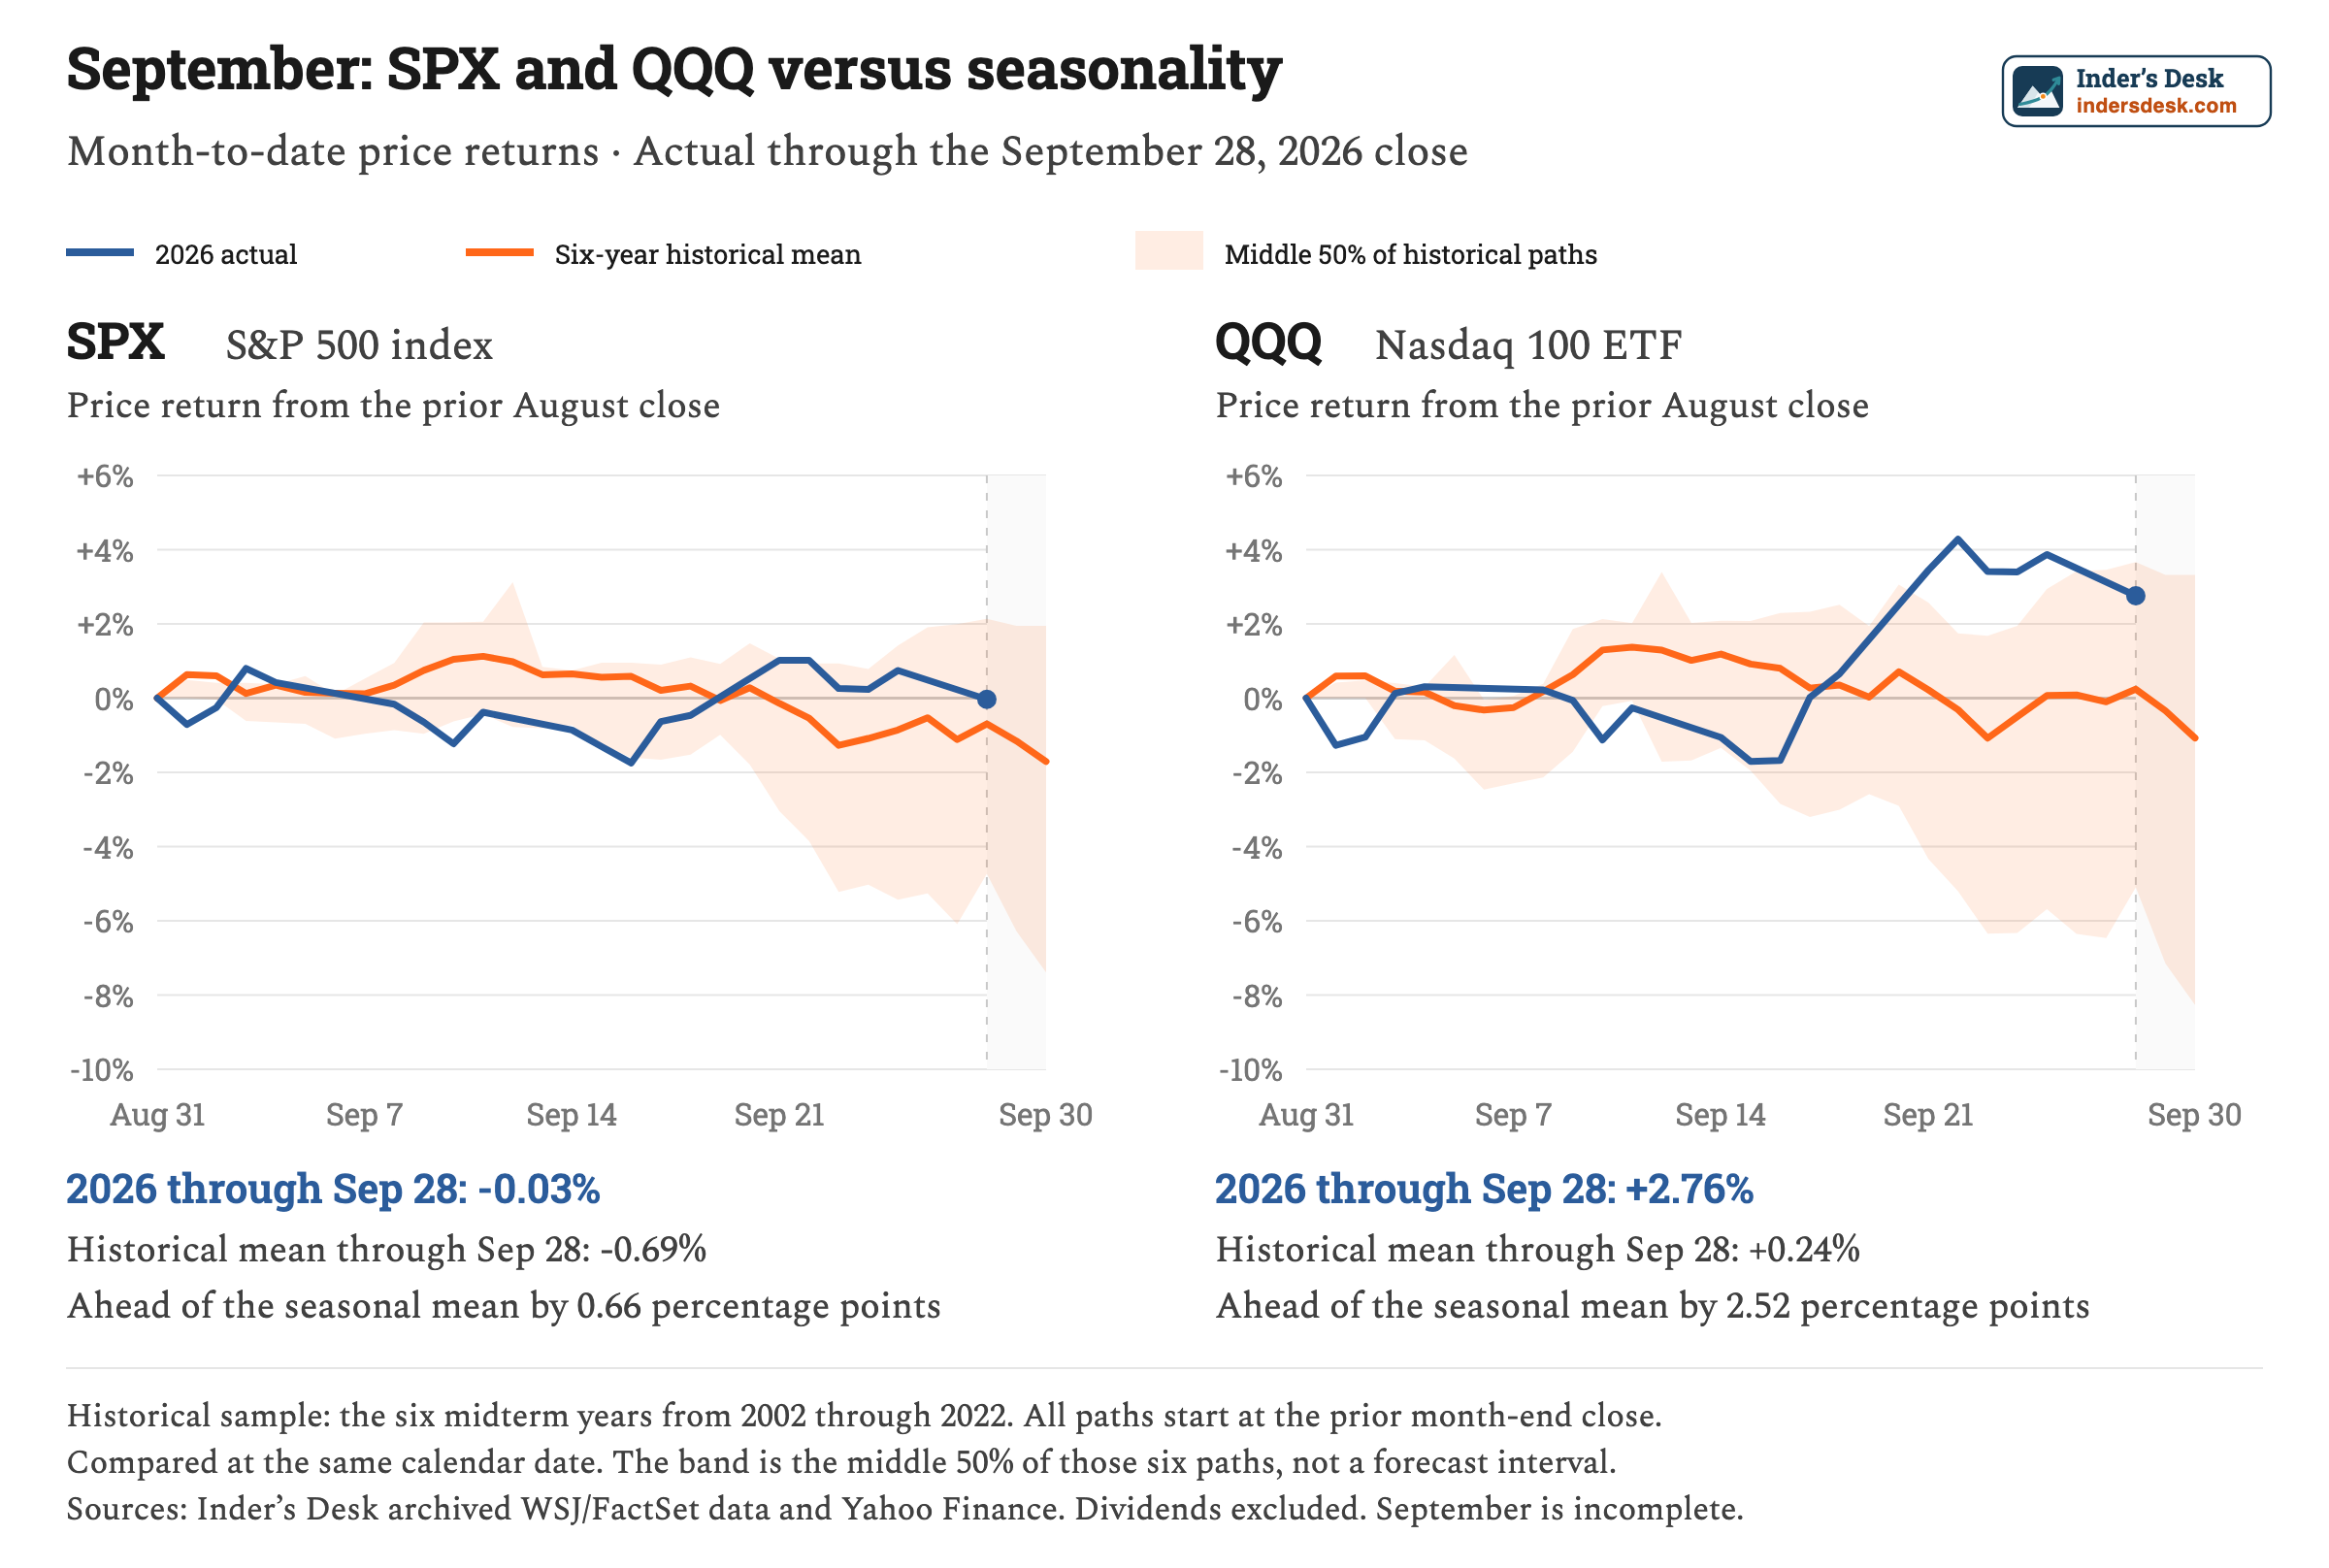
QQQ’s outperformance is the clearest result. The seasonal warning has not become a broad index rout. But September 29 and 30 still count, so this is a progress report rather than a final monthly scorecard.
What October may bring
If October follows the historical pattern, patience could matter more than buying immediately when the calendar turns.
The average path in our sample dips early in October before strengthening later. The second half averaged a 2.83% gain for SPX and 3.48% for QQQ. Both gained in that period in five of the six years.
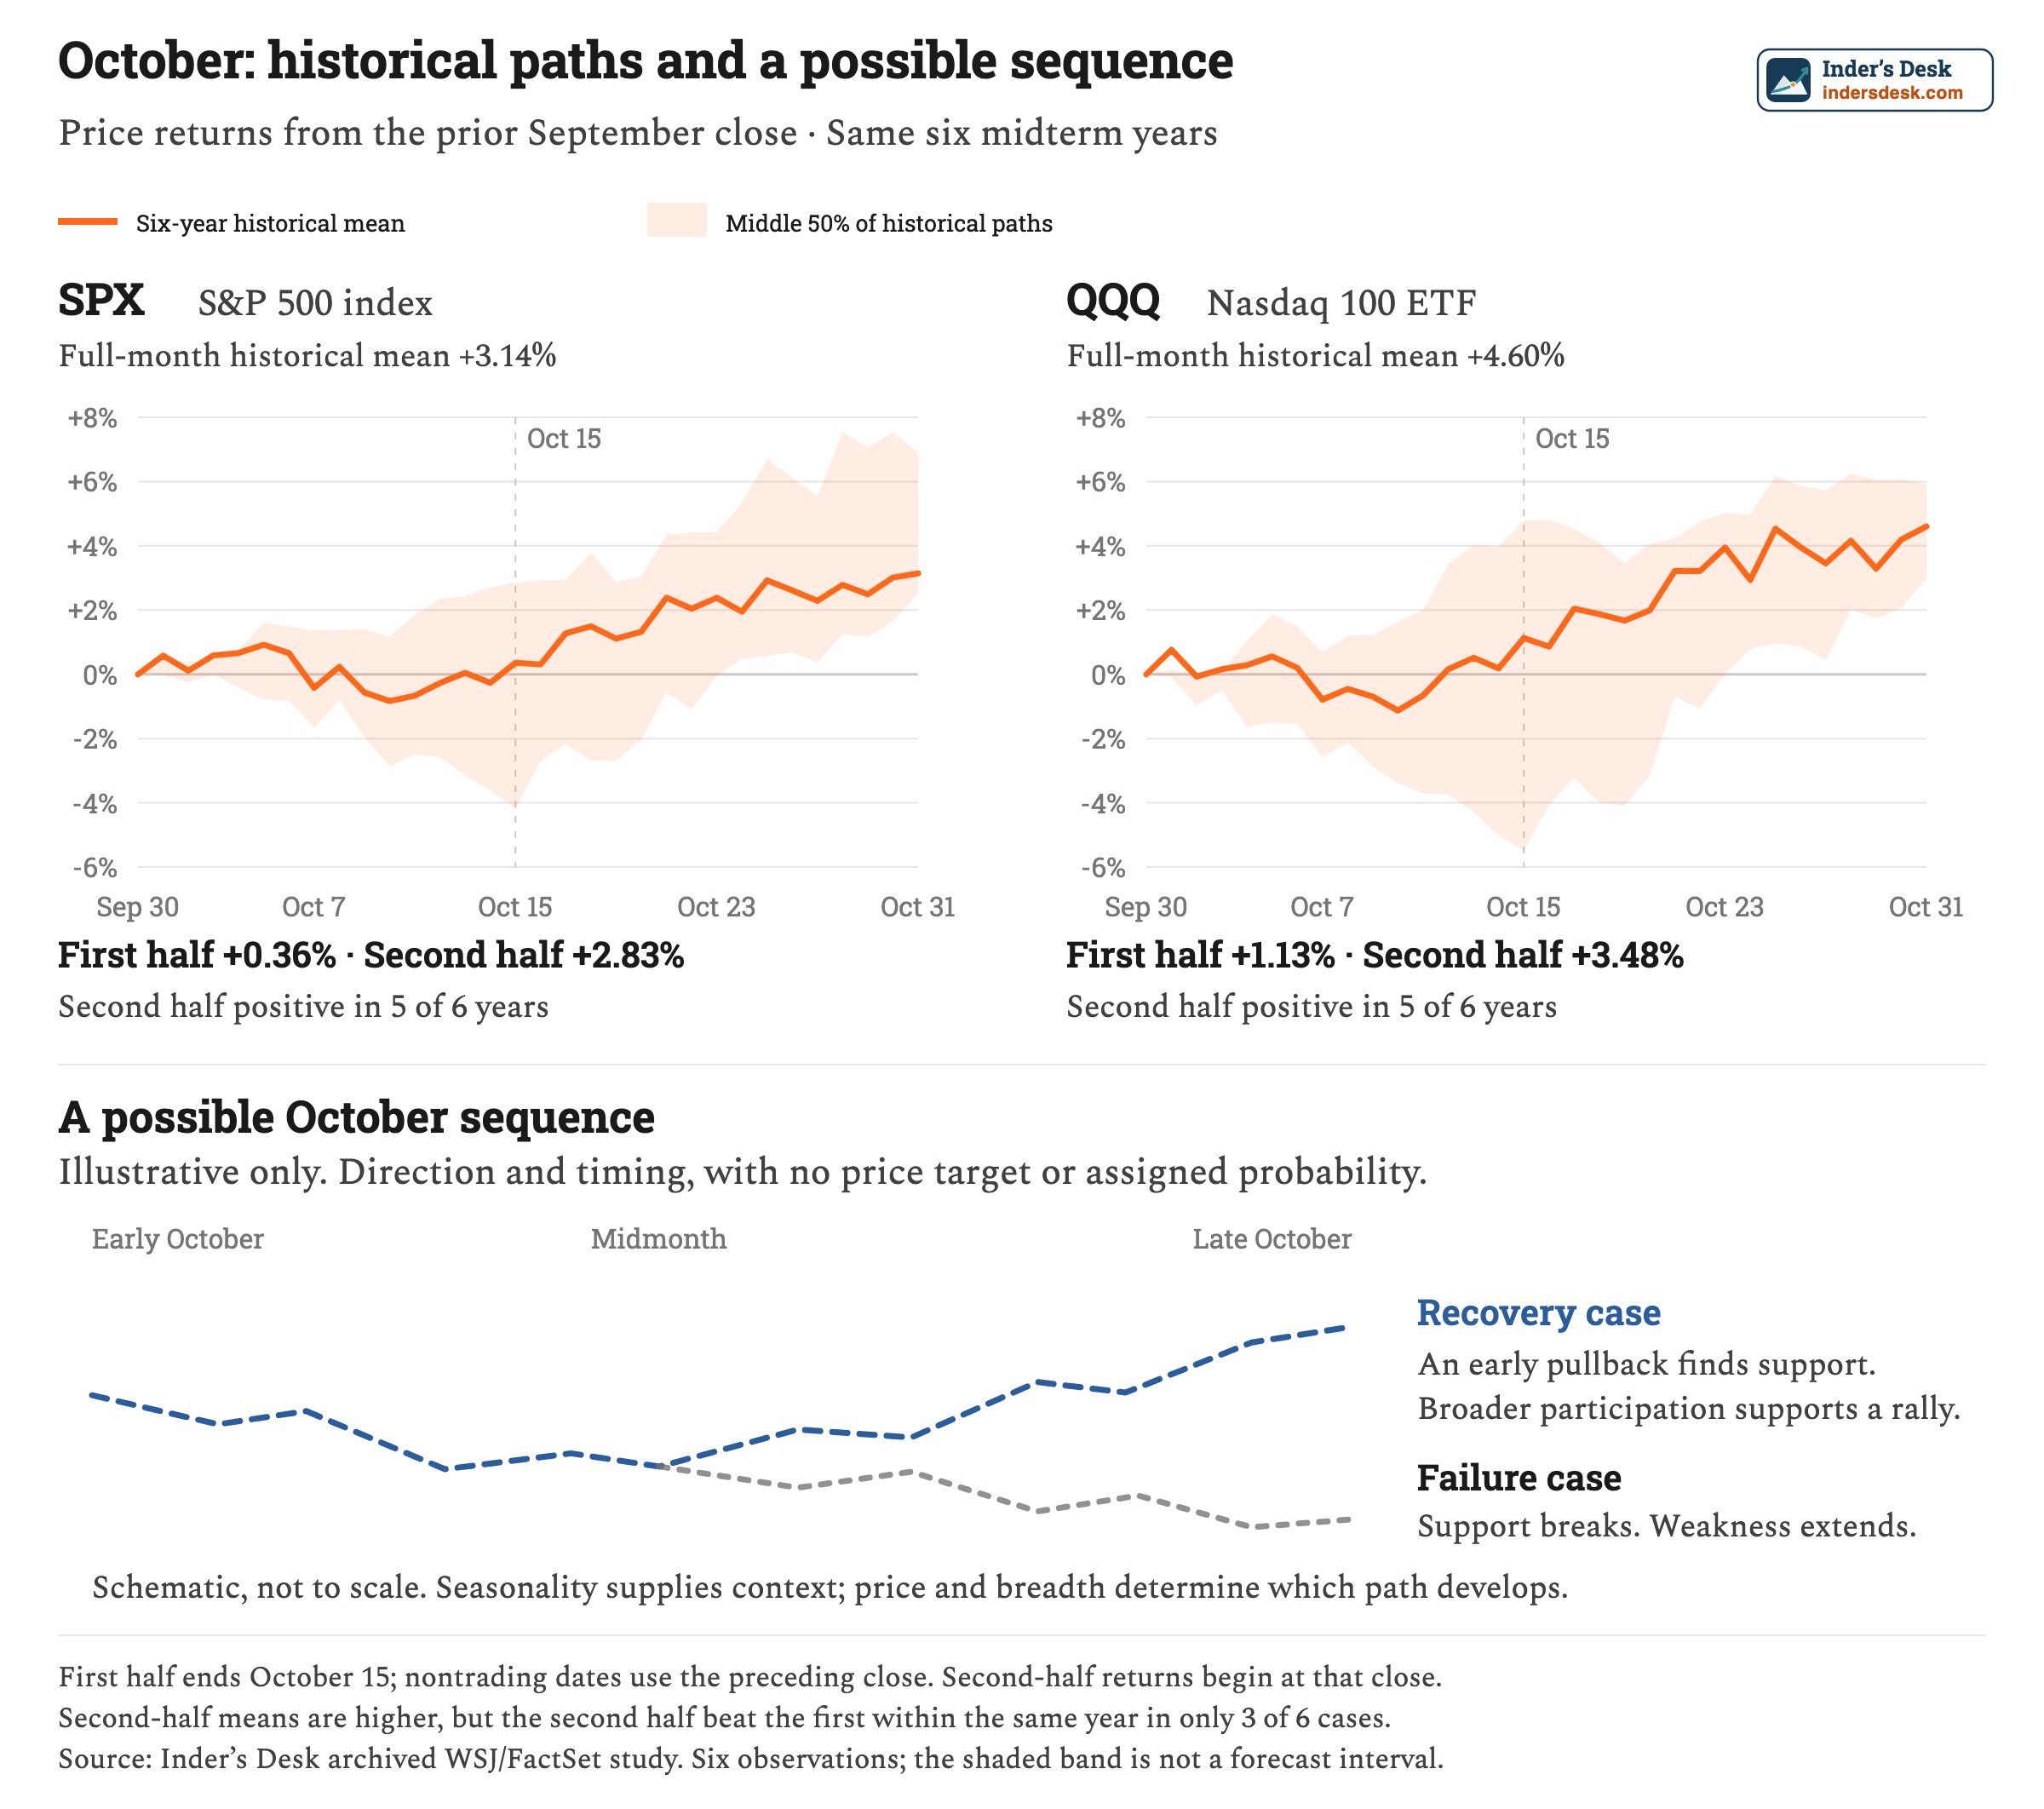
My working scenario is an unsettled start followed by a recovery if pullbacks find support and more stocks join the advance. If support breaks and participation stays weak, the case for that recovery weakens.
Six years are a small sample. The second half beat the first within the same year in only three of six cases, despite its higher average return. The calendar gives us a window to watch, not a date to buy.
I would carry QQQ’s relative strength into October as a useful signal. Then I would watch whether it survives the next pullback and spreads beyond the leaders. That would give the seasonal recovery case firmer footing.
Data through September 28, 2026. SPX is the S&P 500 index; QQQ tracks the Nasdaq 100. Returns exclude dividends. Historical prices come from the archived WSJ/FactSet inputs used in our earlier research. Current closes: SPX and QQQ. The dashed paths are illustrative scenarios.
Disclaimer:
This article is for informational and educational purposes only and does not constitute financial, investment, tax, or legal advice. Any opinions, scenarios, price targets, or market observations reflect my personal views and may change without notice. Investing and trading involve substantial risk, including the possible loss of principal. You are solely responsible for your own investment decisions, position sizing, risk management, and trades. Conduct your own research and consult a qualified professional where appropriate.


