



Last week did not give us a clean risk-on or risk-off signal. It gave us a rotation.
Gold and Bitcoin broke higher. Biotech began outperforming technology. Software continued its recovery. Semiconductors, the market’s recent leader, compressed into an indecisive range.
The question for next week is whether leadership is broadening into new areas or capital is leaving proven earnings stories for increasingly speculative trades. Investors still want risk in selected areas. The answer may come from AI stocks.
Market snapshot: Rotation, not retreat
Situational awareness: The bond market changed the conversation
On Wednesday, the Treasury announced that it would at least double the maximum size of certain long-term bond buybacks from $2 billion to $4 billion per operation. The larger operations will cover Treasury securities with 10 to 30 years remaining and begin September 9.
Treasury described the move as support for liquidity in the long end of the bond market. Long-term yields had been rising as markets absorbed higher oil prices, inflation concerns and the government’s growing financing needs. After the announcement, long-term yields fell, the dollar weakened, and gold and Bitcoin jumped.
The market’s response was revealing. As yields fell and the dollar weakened, investors moved into gold and Bitcoin, assets used to protect purchasing power against inflation, fiscal stress and currency depreciation.
The trade was not simply about better liquidity in Treasury bonds. It reflected concern about what continued intervention may mean for the dollar’s long-term purchasing power.
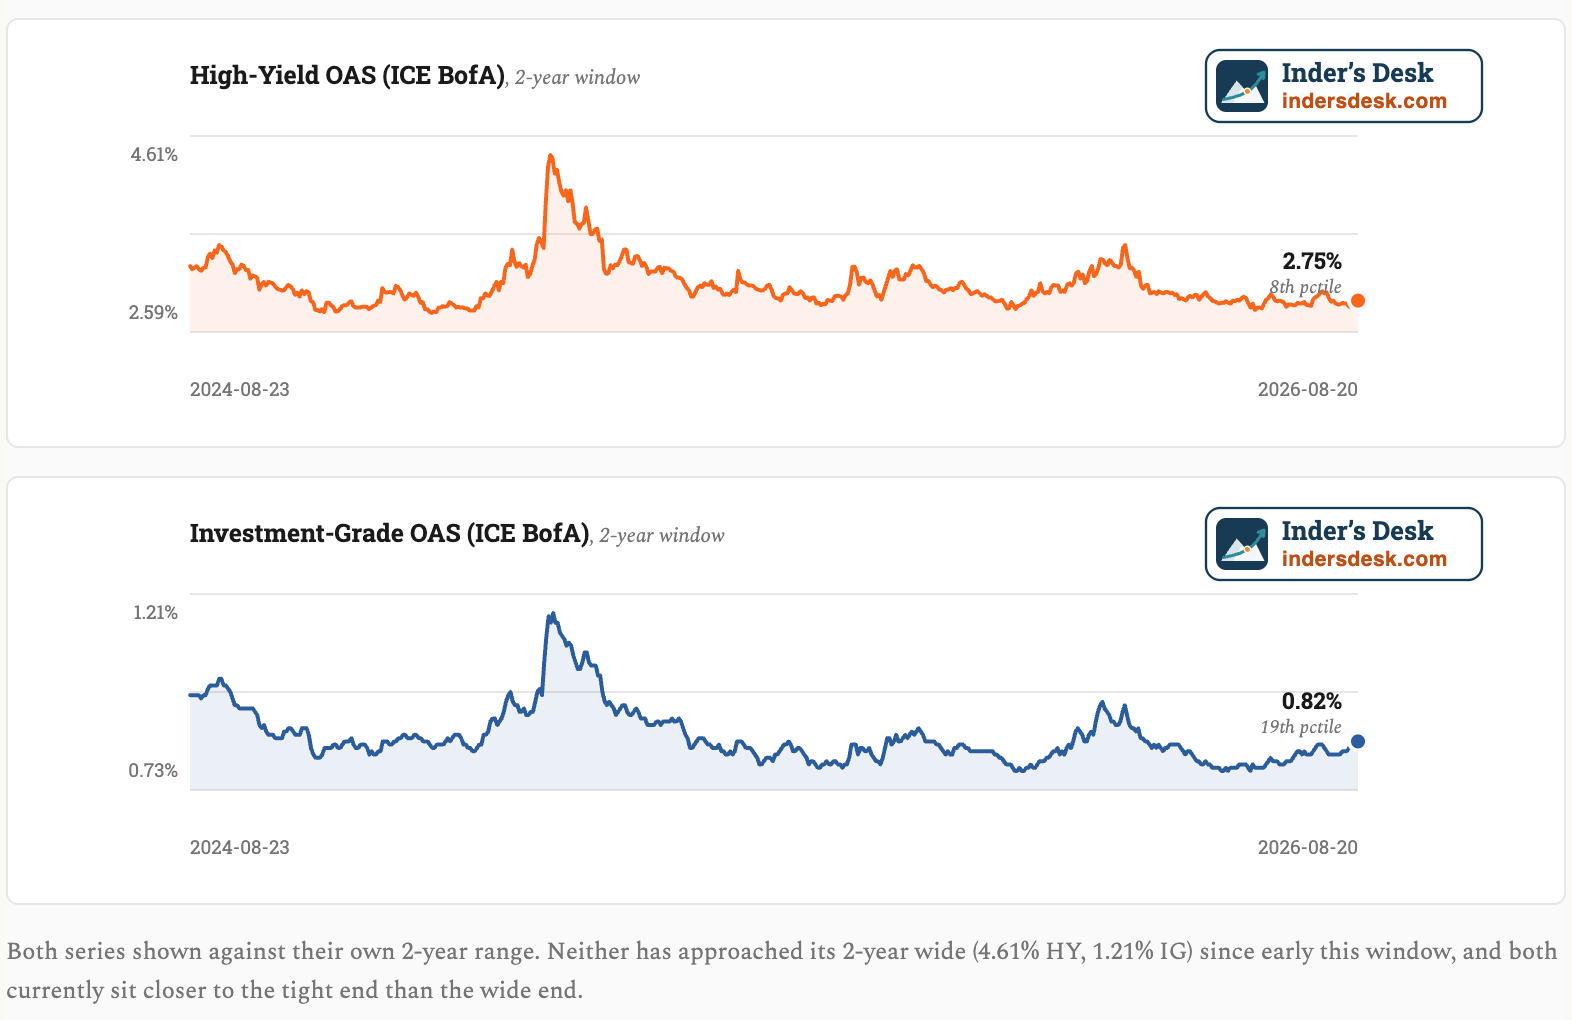
Credit Markets Are Not Signaling Stress
Credit markets are not signaling broad corporate stress. Lenders are demanding some of the smallest risk premiums in two years, which is inconsistent with widespread concern about near-term defaults.
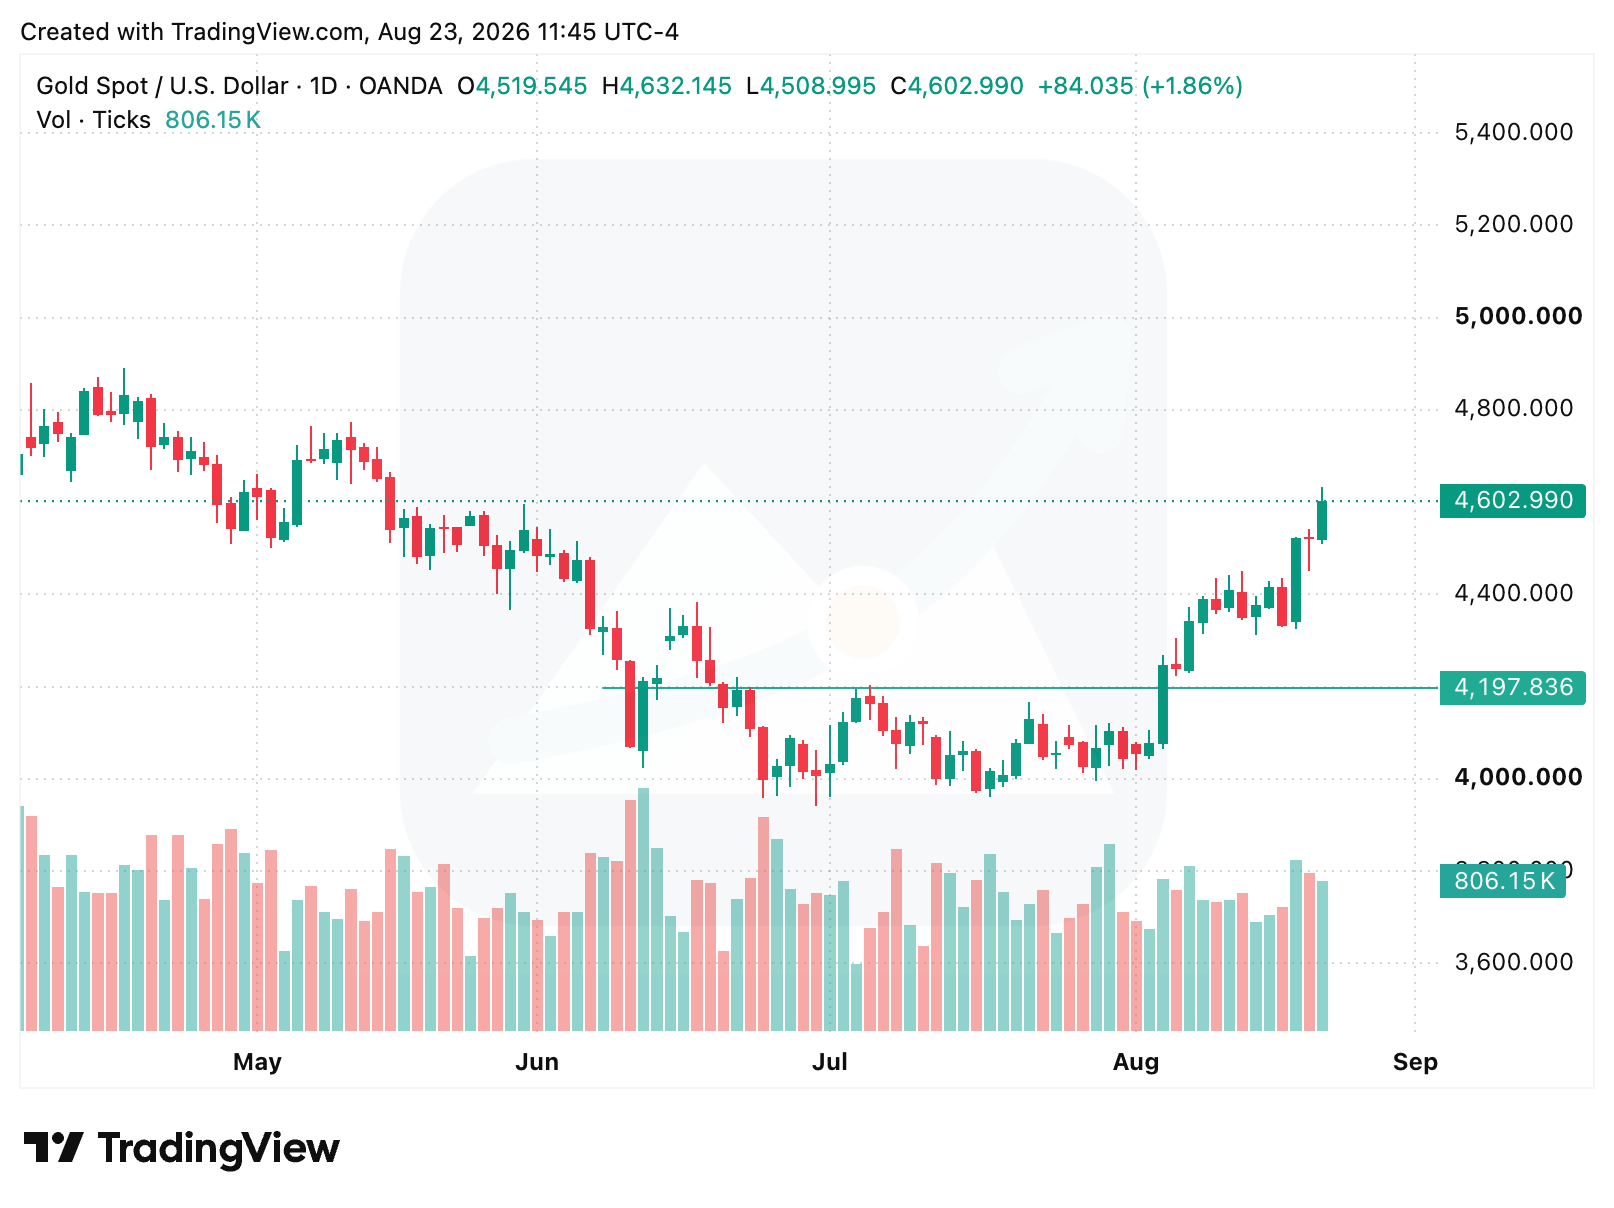
Precious Metals/Gold
Gold rallied sharply along with other precious metals.
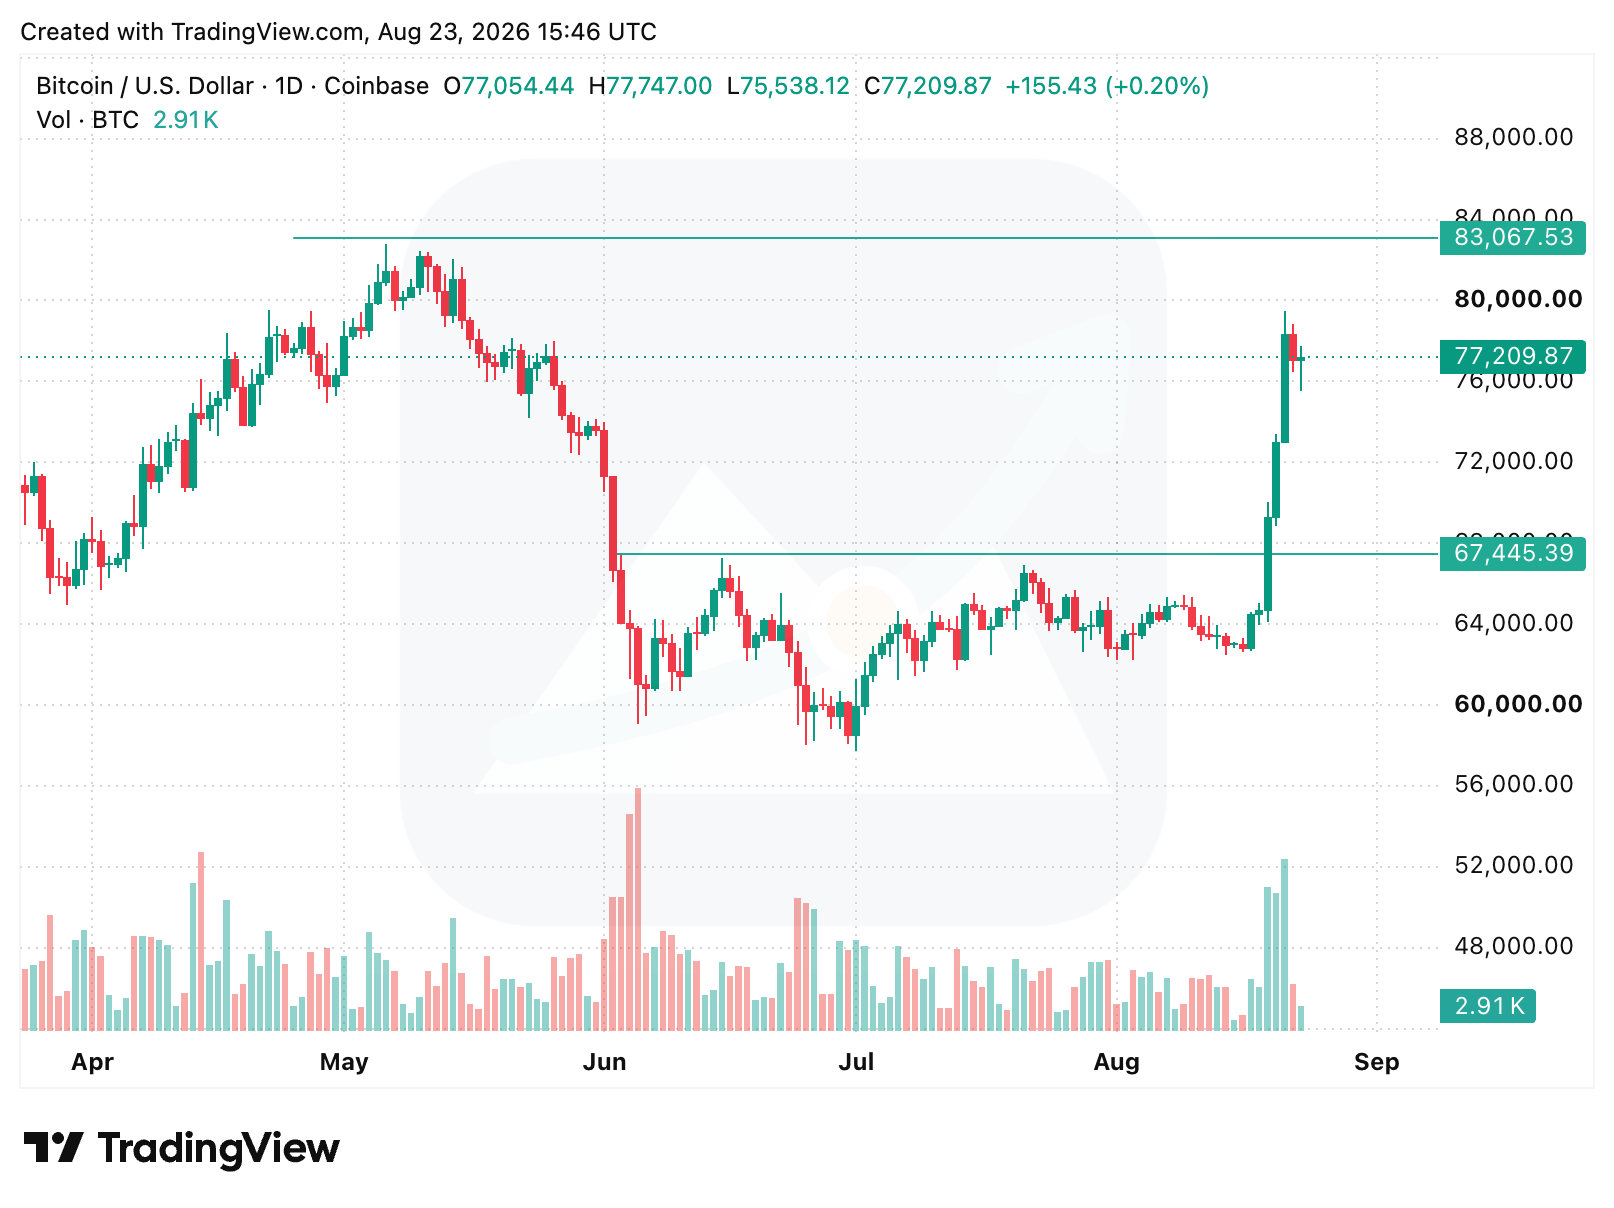
Crypto/Bitcoin
Bitcoin broke out of its trading range and rallied strongly through the rest of the week. A break and a close above the previous high near 83,000 would signal continued strength in Bitcoin, crypto and related equities.
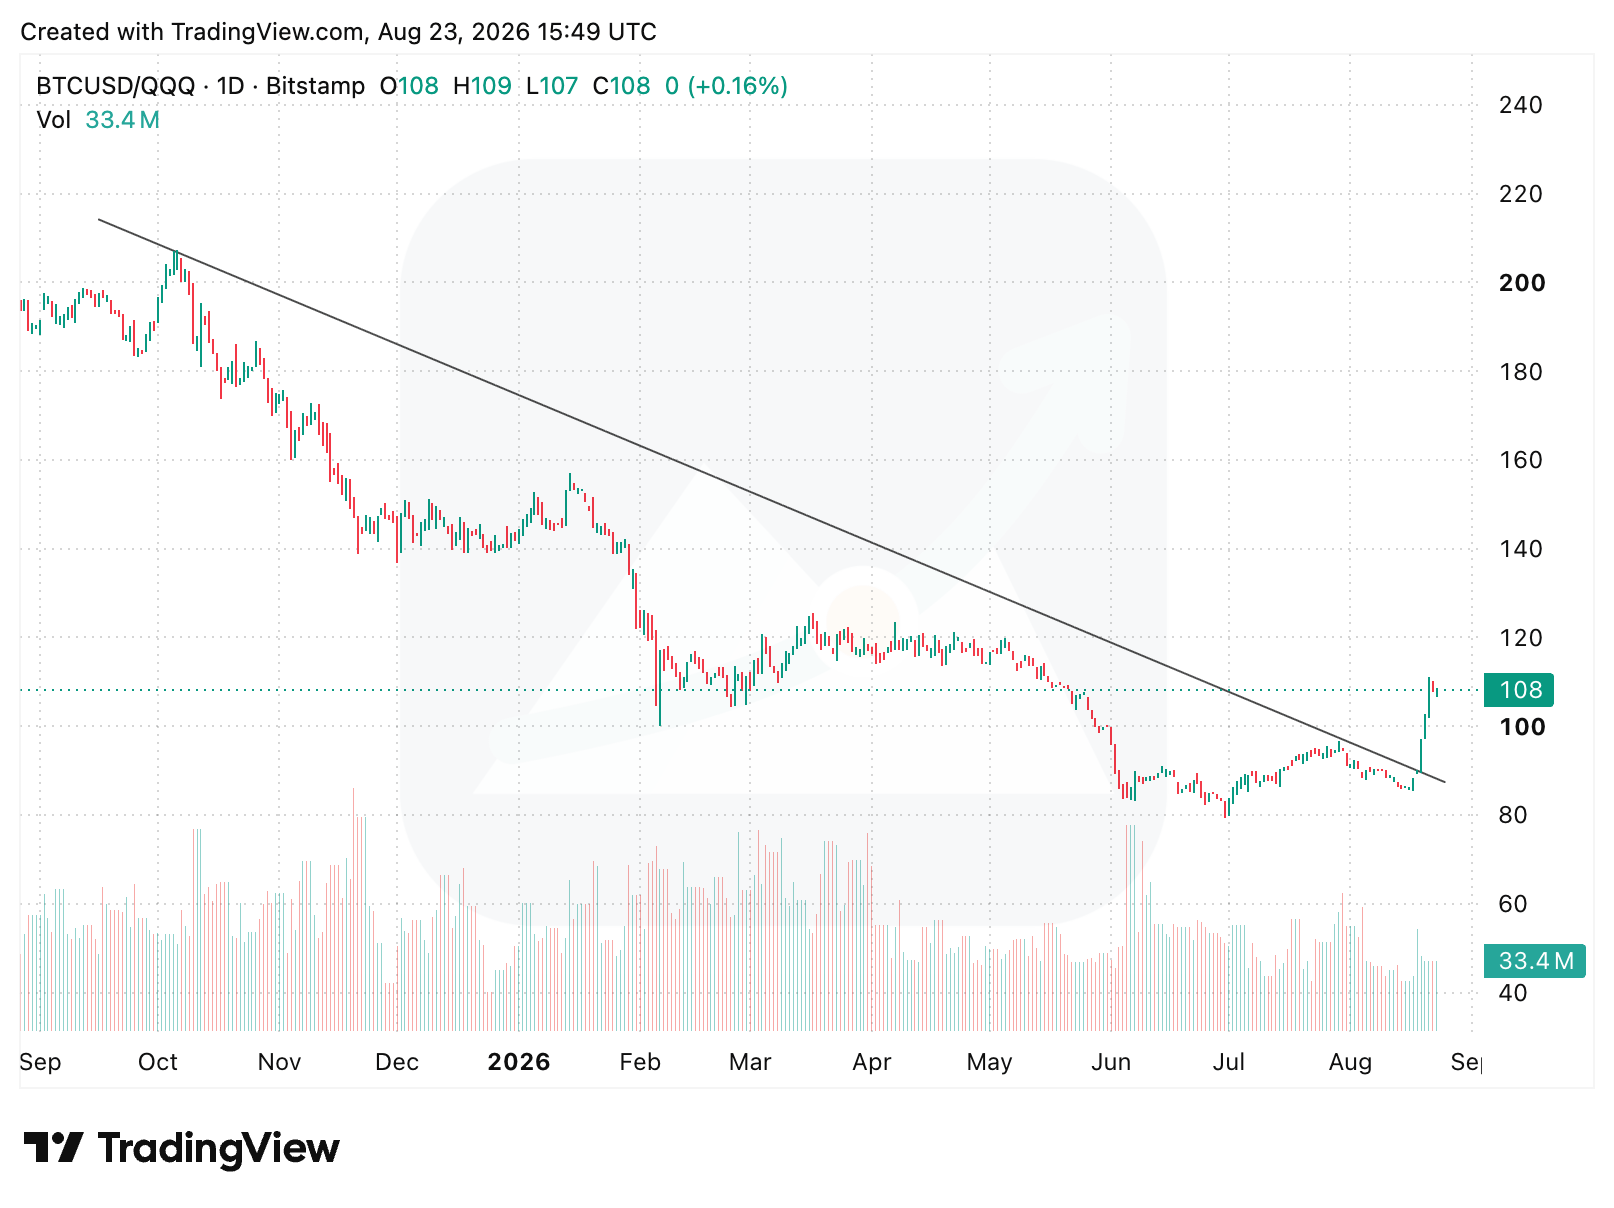
Bitcoin versus QQQ
The relative-strength chart may be more important than Bitcoin’s price alone. Bitcoin broke an eleven-month downtrend against the Nasdaq 100. In plain English, Bitcoin has started outperforming large-cap technology. One sharp move does not establish a durable trend. Bitcoin now needs to hold above the broken line and continue making higher relative highs.
These moves in Bitcoin and gold say investors are still willing to pay for protection against a weaker dollar, inflation and fiscal uncertainty.
Sector leadership: Biotech is trying to become new leadership
The week’s largest individual move came from MRNA 0.00%↑. Moderna and Merck reported positive topline results from a Phase 3 trial of intismeran, a personalized mRNA cancer therapy, combined with Keytruda in patients with high-risk melanoma whose tumors had been surgically removed. The study met its primary goal of extending the time before cancer returned and a key secondary goal involving the spread of cancer to other parts of the body.
Moderna rose more than 120% in one session. The company has not yet presented the detailed trial results, including the size of the benefit or an overall-survival readout. The market was repricing the possibility that Moderna’s mRNA platform can create value beyond respiratory vaccines.
Moderna shows what applied AI looks like: using patient-specific biological data to design personalized medicines.
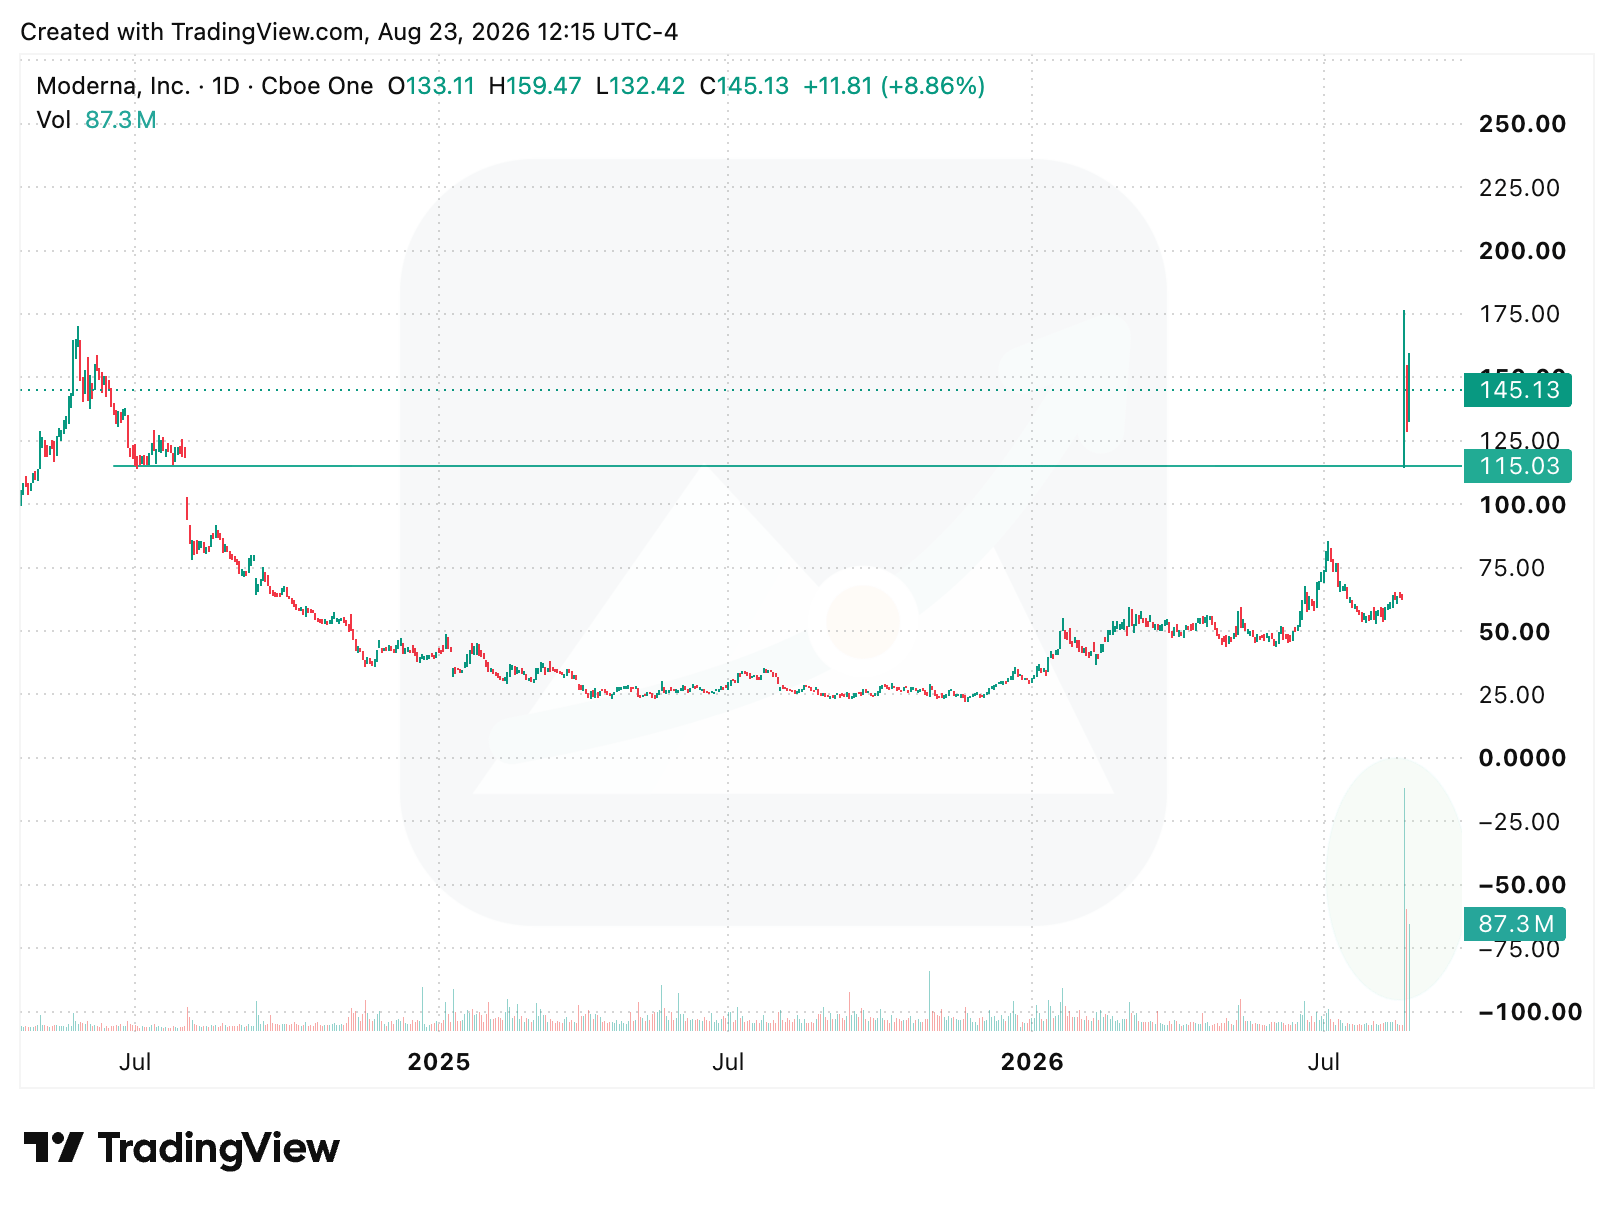
The old level near 115 is now the key reference. Holding above it would keep the breakout intact. Losing it would suggest that the first reaction ran ahead of the evidence.
XBI vs. QQQ
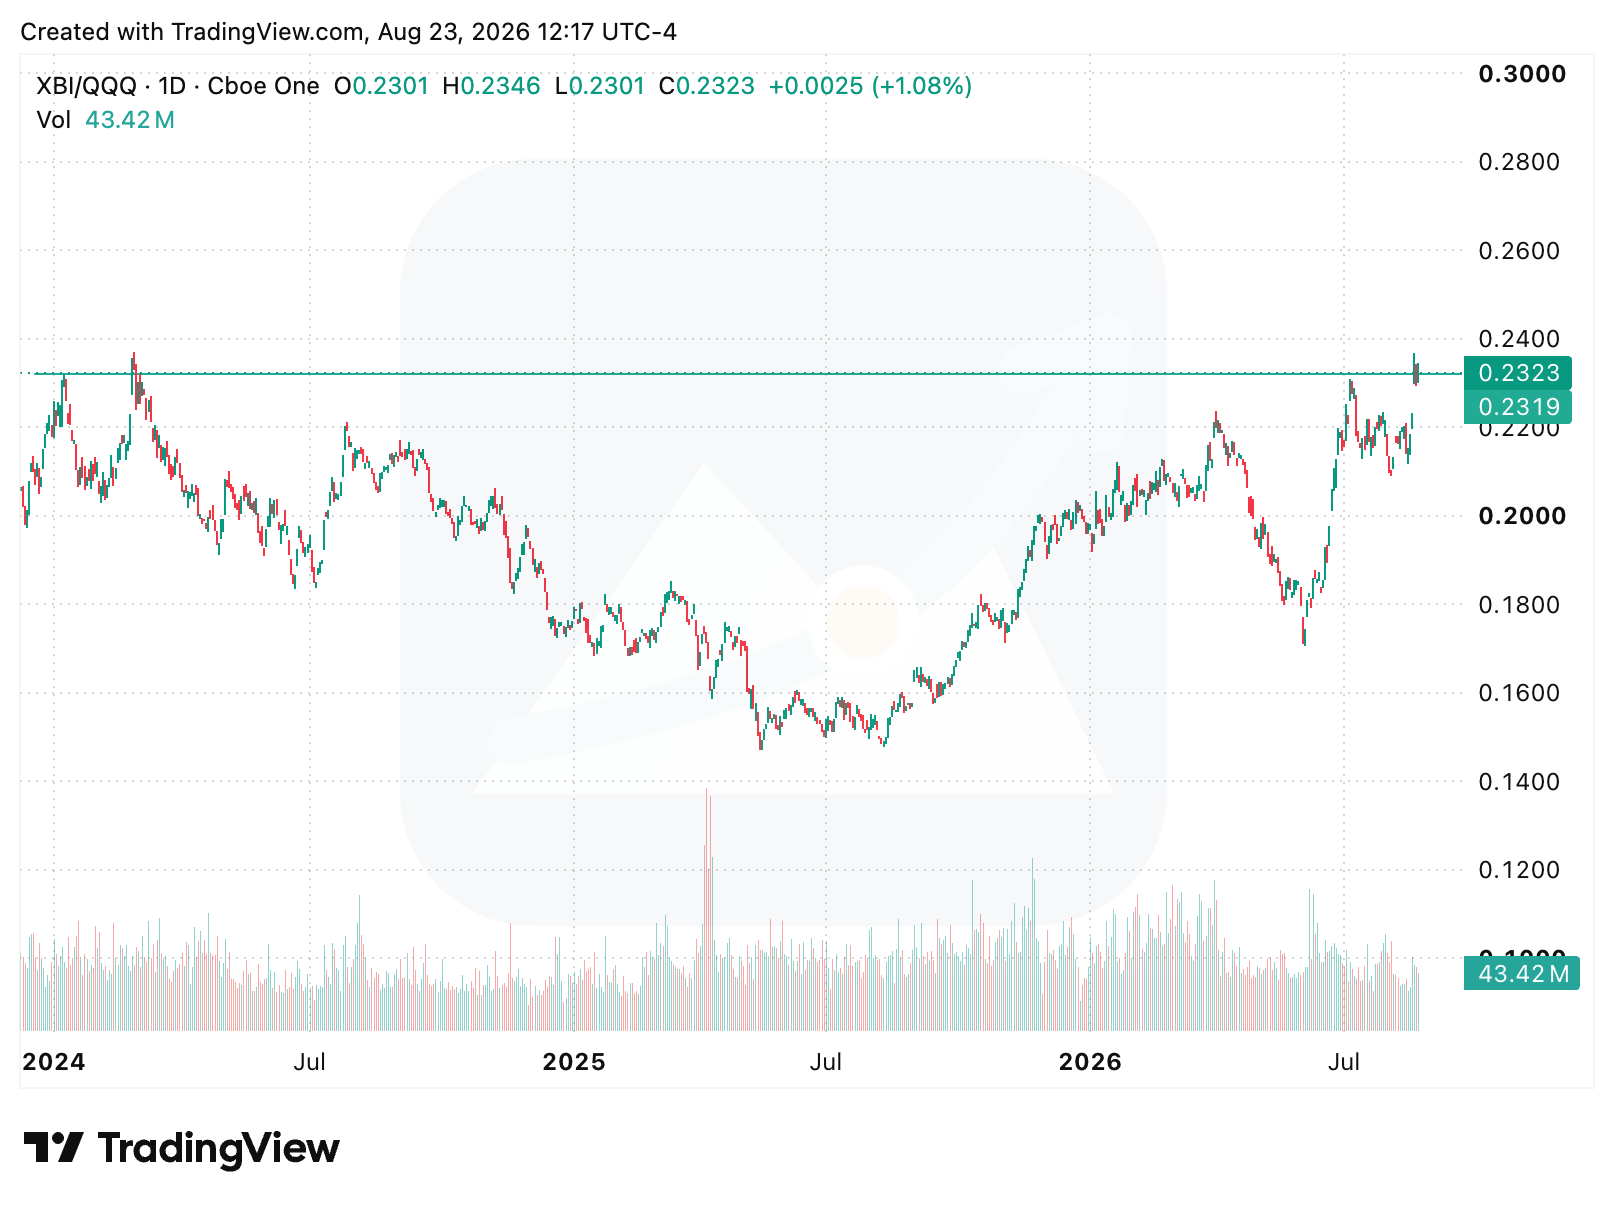
The broader XBI 0.00%↑ chart makes this more than a one-stock story, supporting a constructive outlook for biotech. XBI is attempting to break a two-year resistance level relative to QQQ. If the breakout holds, biotech would confirm genuine leadership. A quick move back below the breakout would turn it into another false start.
Software is improving, but it has not broken out
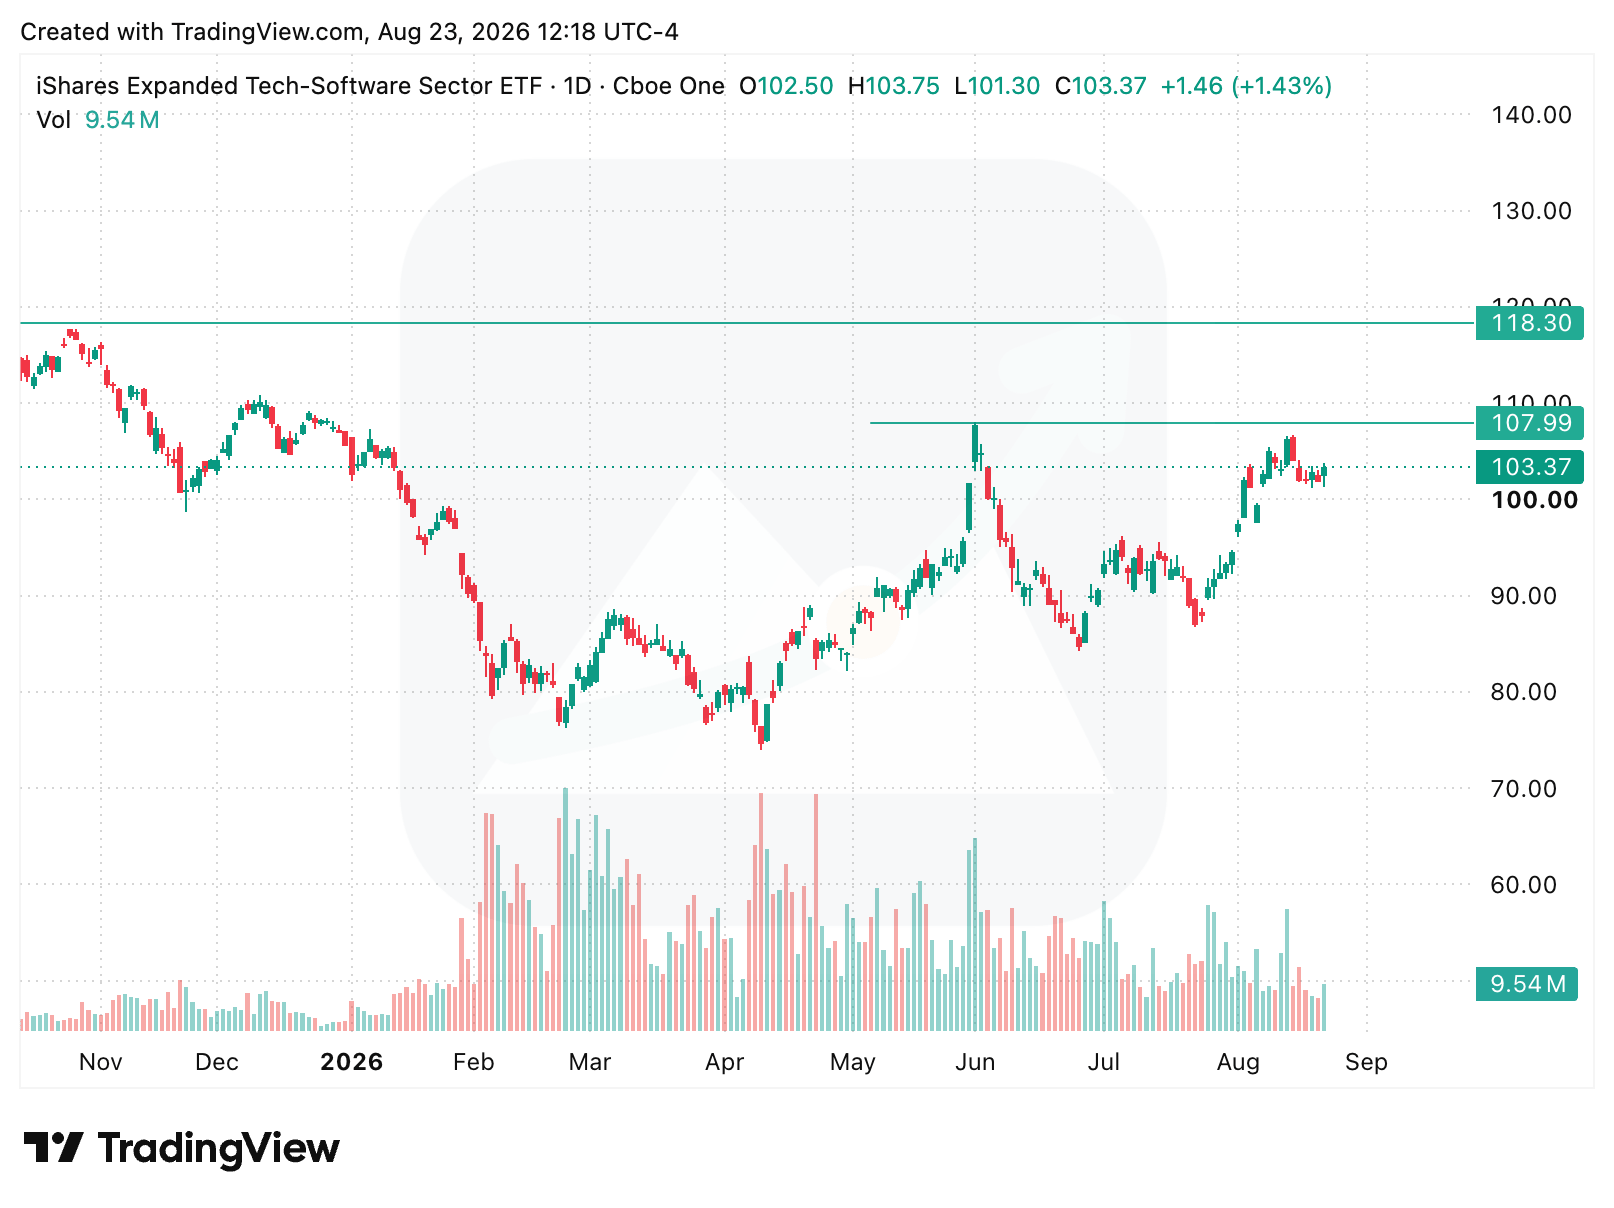
IGV has recovered strongly from its spring decline but remains below resistance near 108. A breakout above that level would add a group with recurring revenue and established enterprise demand to the market’s emerging leadership.
Semiconductors are at a decision point
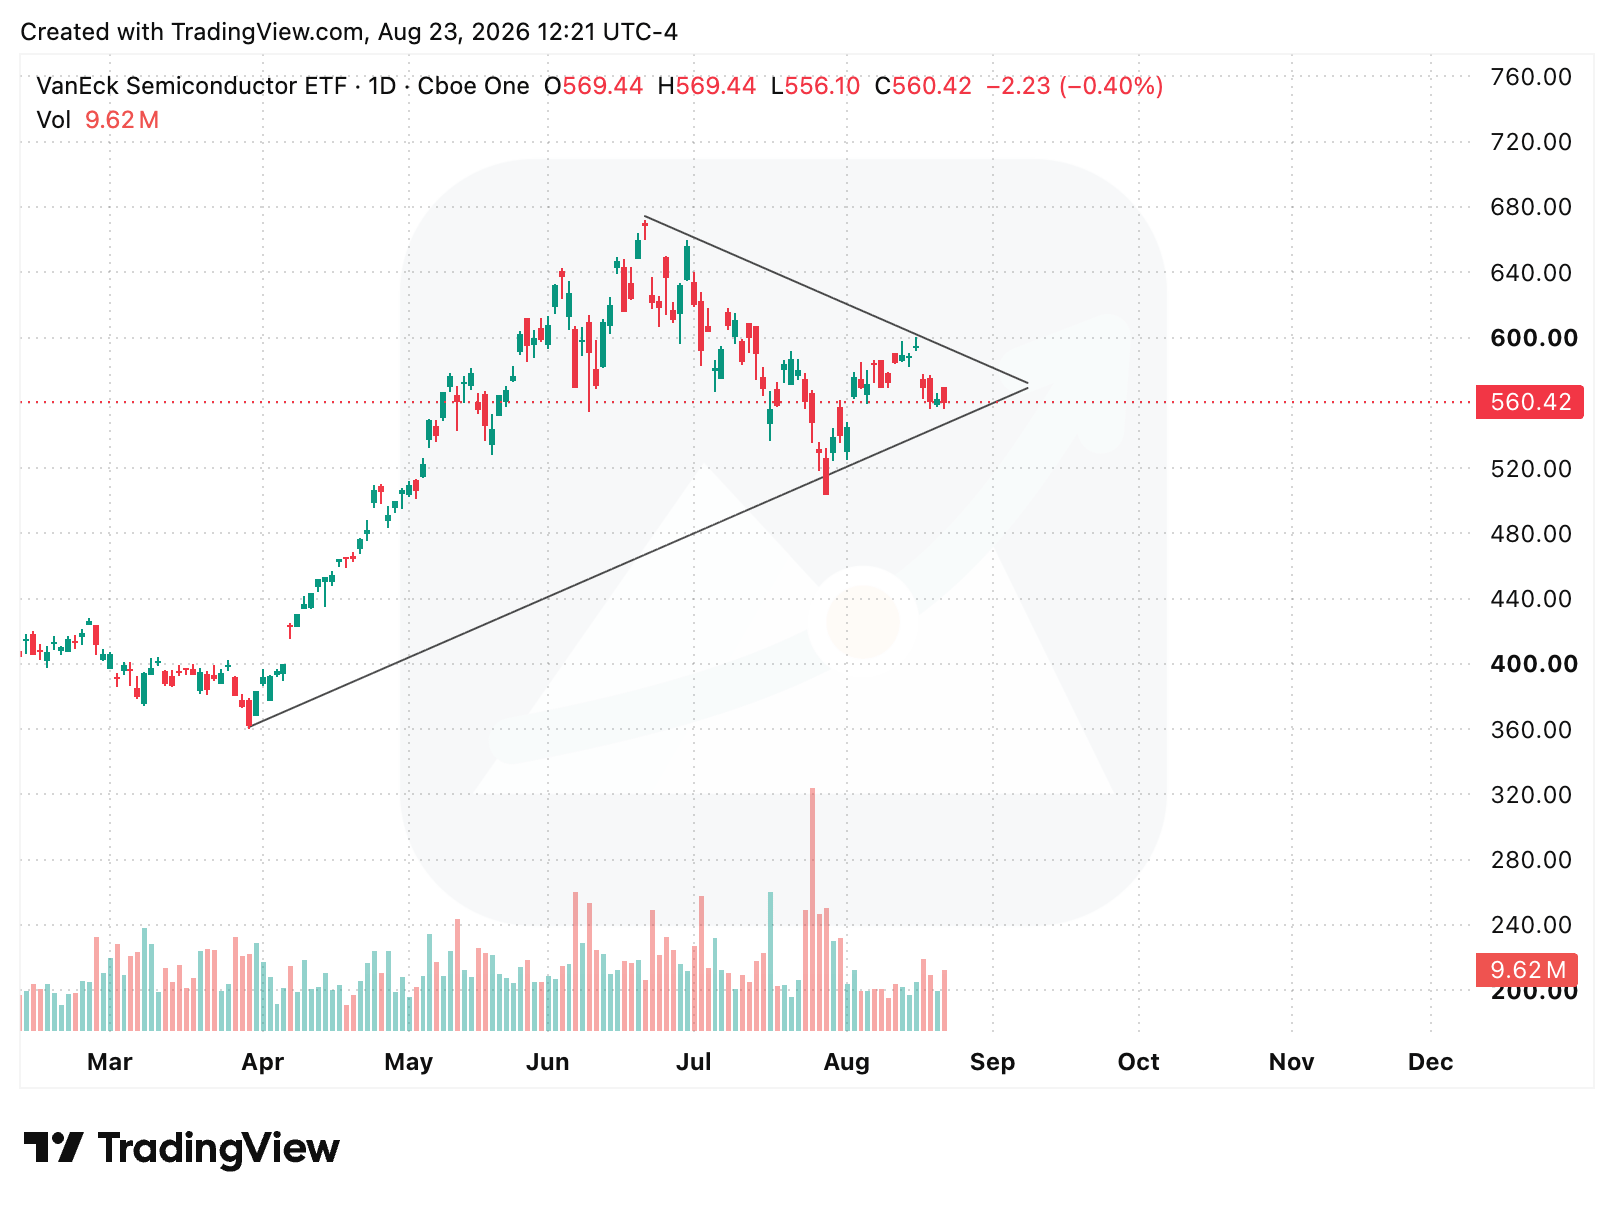
SMH 0.00%↑ is forming a triangle made of lower highs and higher lows. Buyers are defending the pullbacks, but sellers are still appearing at progressively lower prices. Until one side wins, the chart is indecisive rather than bullish or bearish.
Market Signals: AI Infrastructure is the market’s next decision

AI infrastructure stocks enter the week with two potentially bullish developments. First, weekend reporting said some of Nvidia’s largest customers have been told that prices for servers containing its chips will rise by more than 15% for many configurations shipped early next year. The reported price increases apply to systems built around Vera Rubin and Grace Blackwell and are driven partly by higher memory costs.
The investor question is who captures the economics. If Nvidia can raise prices faster than its costs, that is pricing power. If the increase merely passes higher memory costs through to customers, the benefits may accrue more heavily to memory suppliers. Higher memory profits could also encourage new capacity and eventually recreate the familiar boom-and-bust memory cycle.
Second, Reuters reported, citing an investor letter, that Citadel had shed more than 80% of the aggregate risk acquired from Leopold Aschenbrenner’s Situational Awareness portfolio. Citadel completed nearly 100 block trades totaling more than $4 billion as it distributed the positions. That does not identify every stock sold or eliminate every remaining seller. It suggests that much of the liquidation-related overhang may already have passed through the market.

The memory question is more complicated
The price increases may be good news for memory producers, but the market has already awarded some of that value in advance. Micron is trading at about 10 times book value, nearly three times its previous peak of 3.5 times book. The valuation is no longer pricing an ordinary memory upcycle. It is pricing a future in which AI and high-bandwidth memory permanently improve Micron’s earnings power and business quality.
That may prove correct. But higher profits could result in greater capital spending, which would add more capacity and eventually create a memory glut. But is this time different?
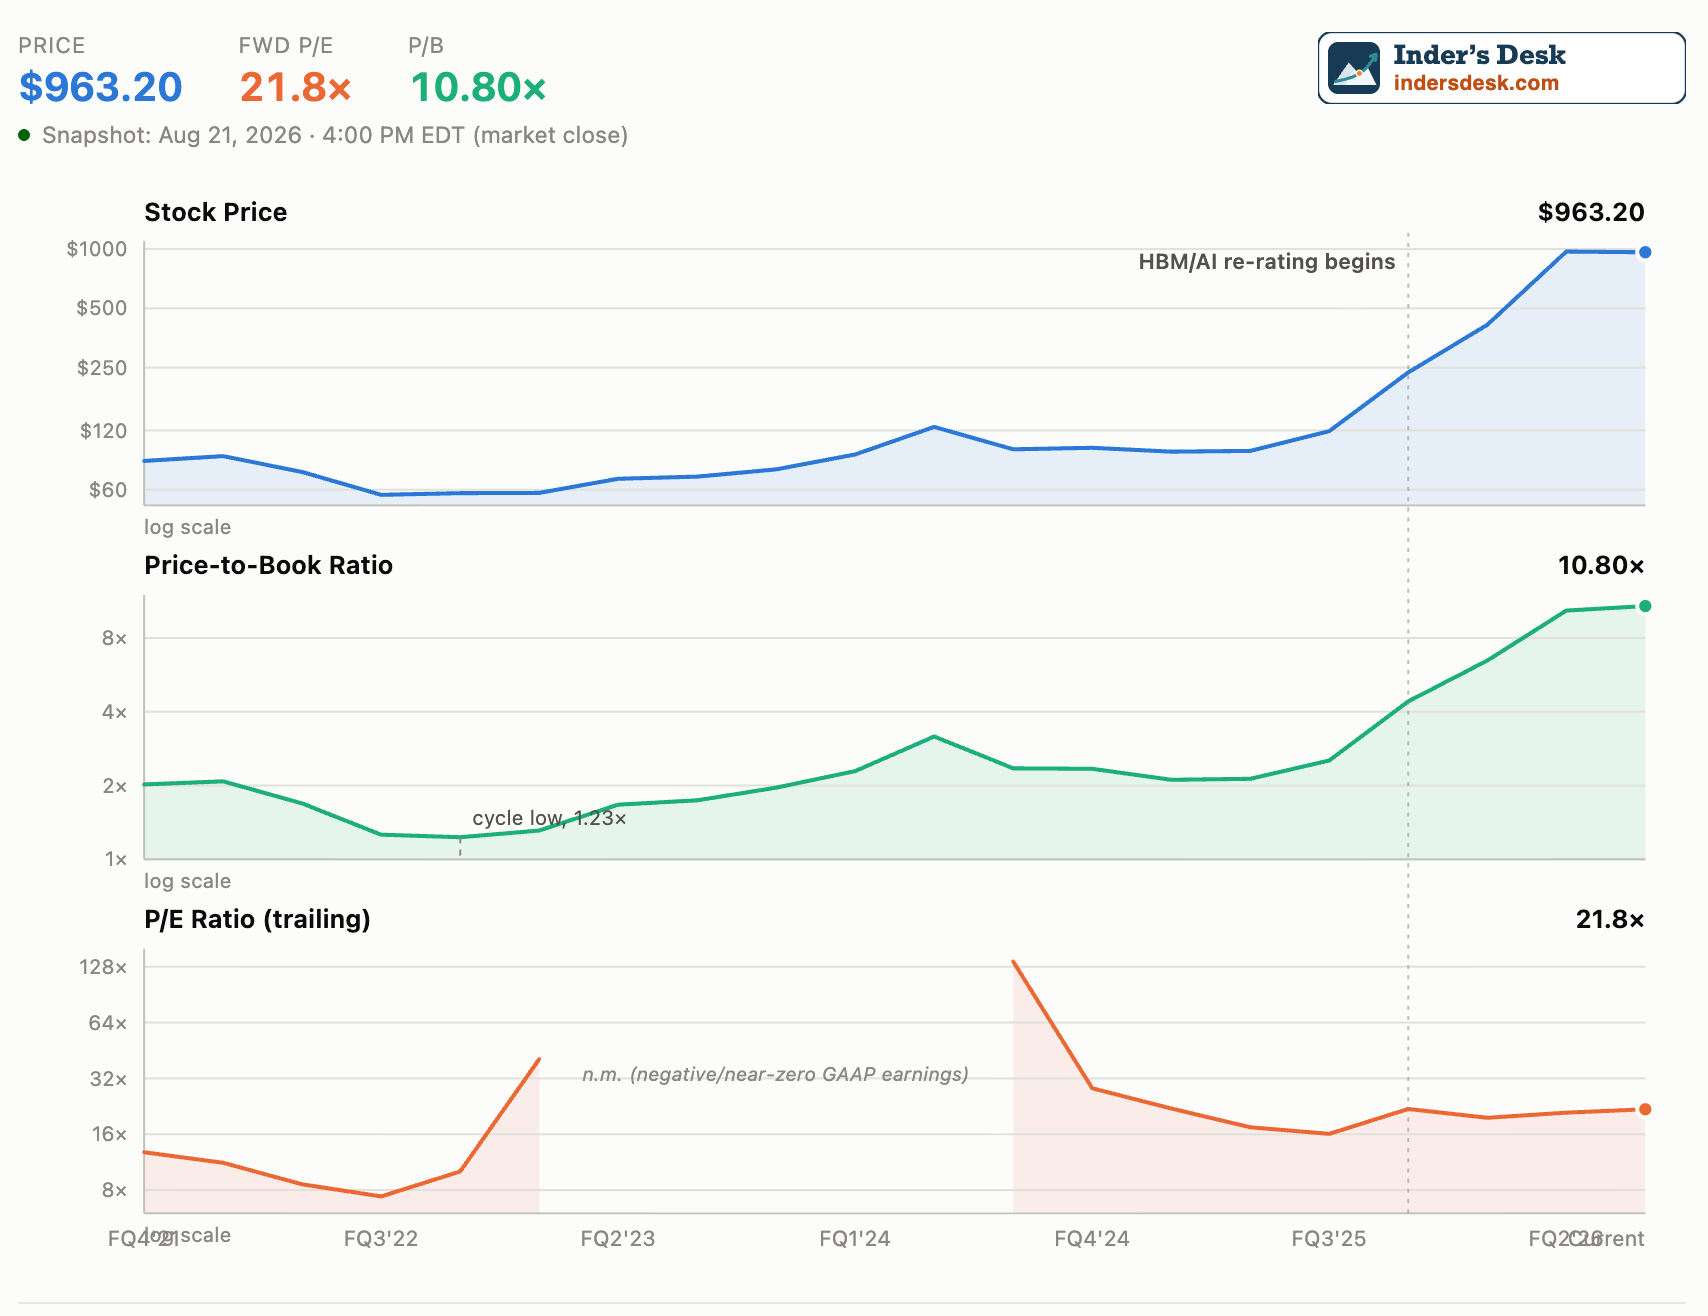
I discussed the full valuation reset here:

Micron Technicals
MU 0.00%↑ has been consolidating in a very narrow range and has formed an inverse head-and-shoulders pattern in the past month. Can it break out above 1,050 and continue the trend?
We will find out soon!

Where AI value may accrue
Token usage is already growing exponentially as agents and machines keep working after the human workday ends. That creates demand throughout the AI factory, not only for the chips. I explained the larger demand loop in this week’s podcast:

Networking may be the quieter beneficiary
The usefulness of AI depends partly on how quickly the answer reaches the customer. As more products move from typed chat toward voice and autonomous agents, milliseconds become part of product quality.
That makes networking a potential second-order beneficiary. Arista supplies the scale-out and front-end networks connecting large AI clusters. Cloudflare operates an edge network that can place applications and inference closer to users.
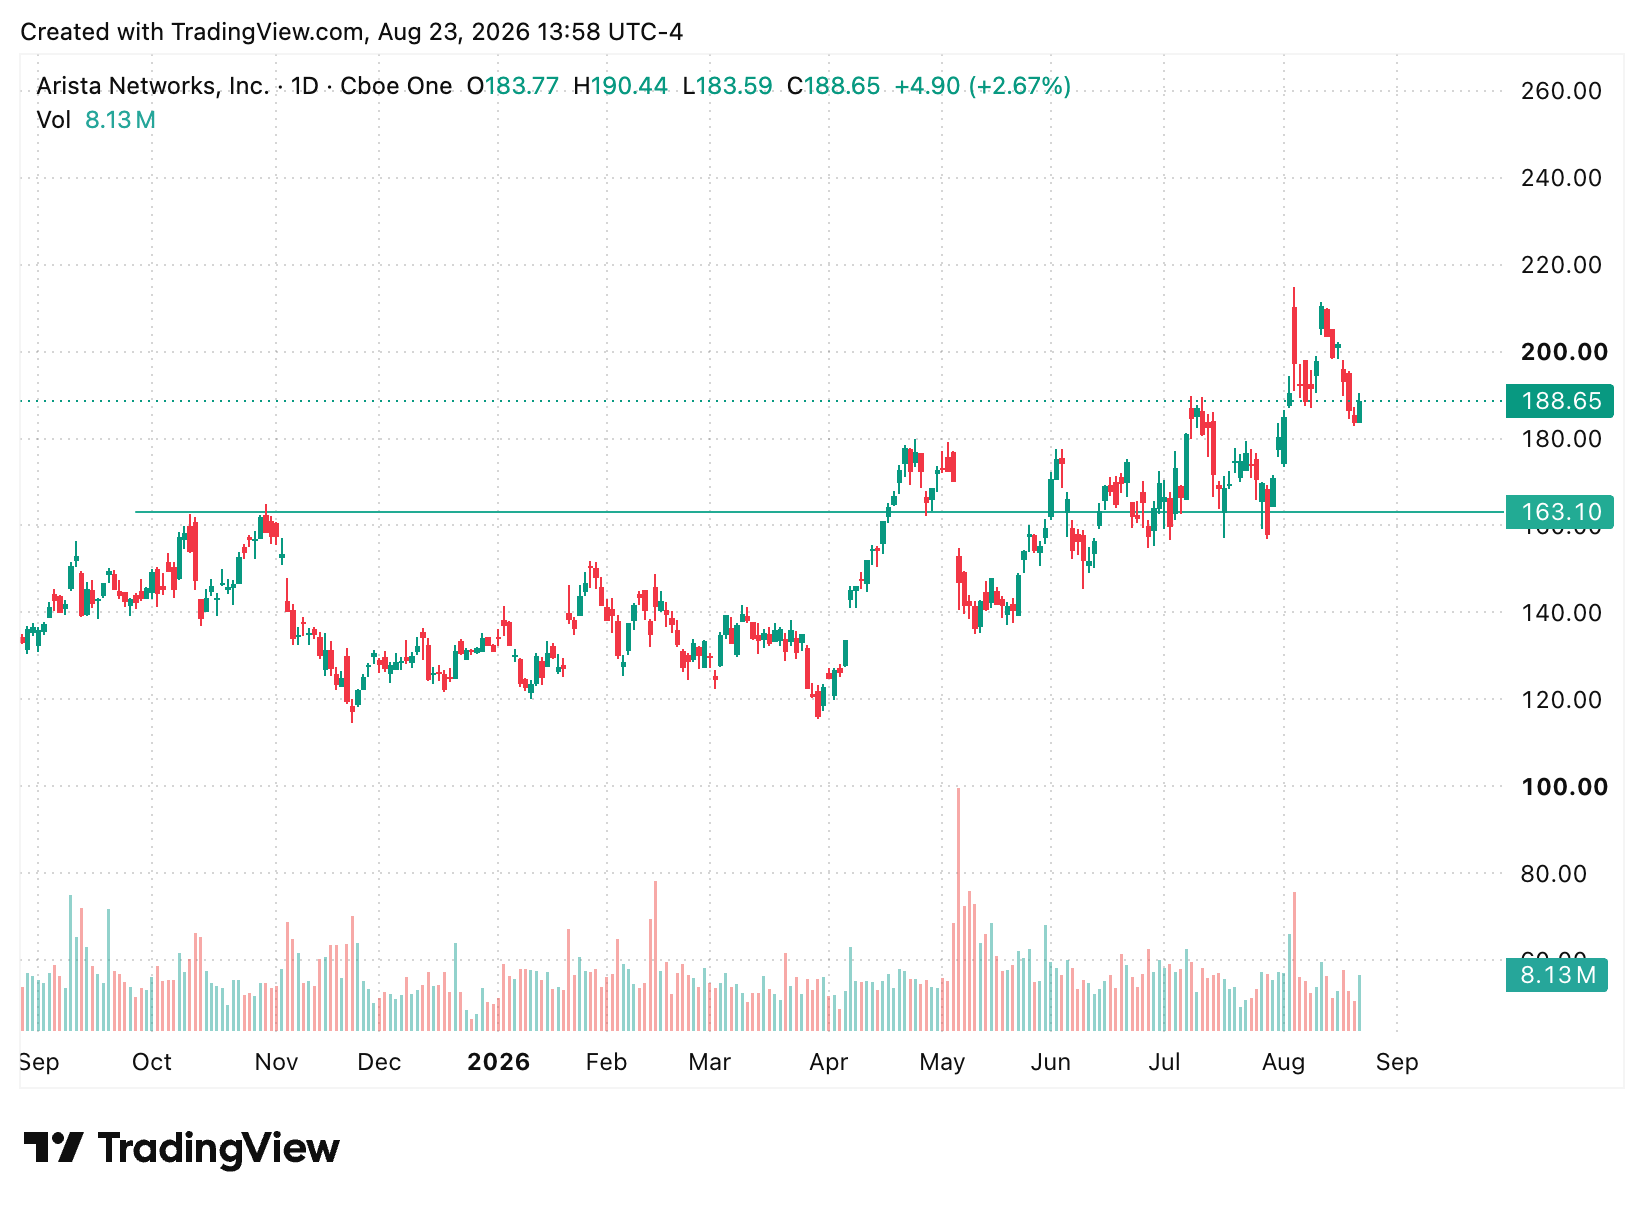
ANET remains above its prior breakout near 163. The chart is consolidating within an uptrend rather than breaking down.
NET broke above its old ceiling near 260. Holding that level would keep the breakout intact.
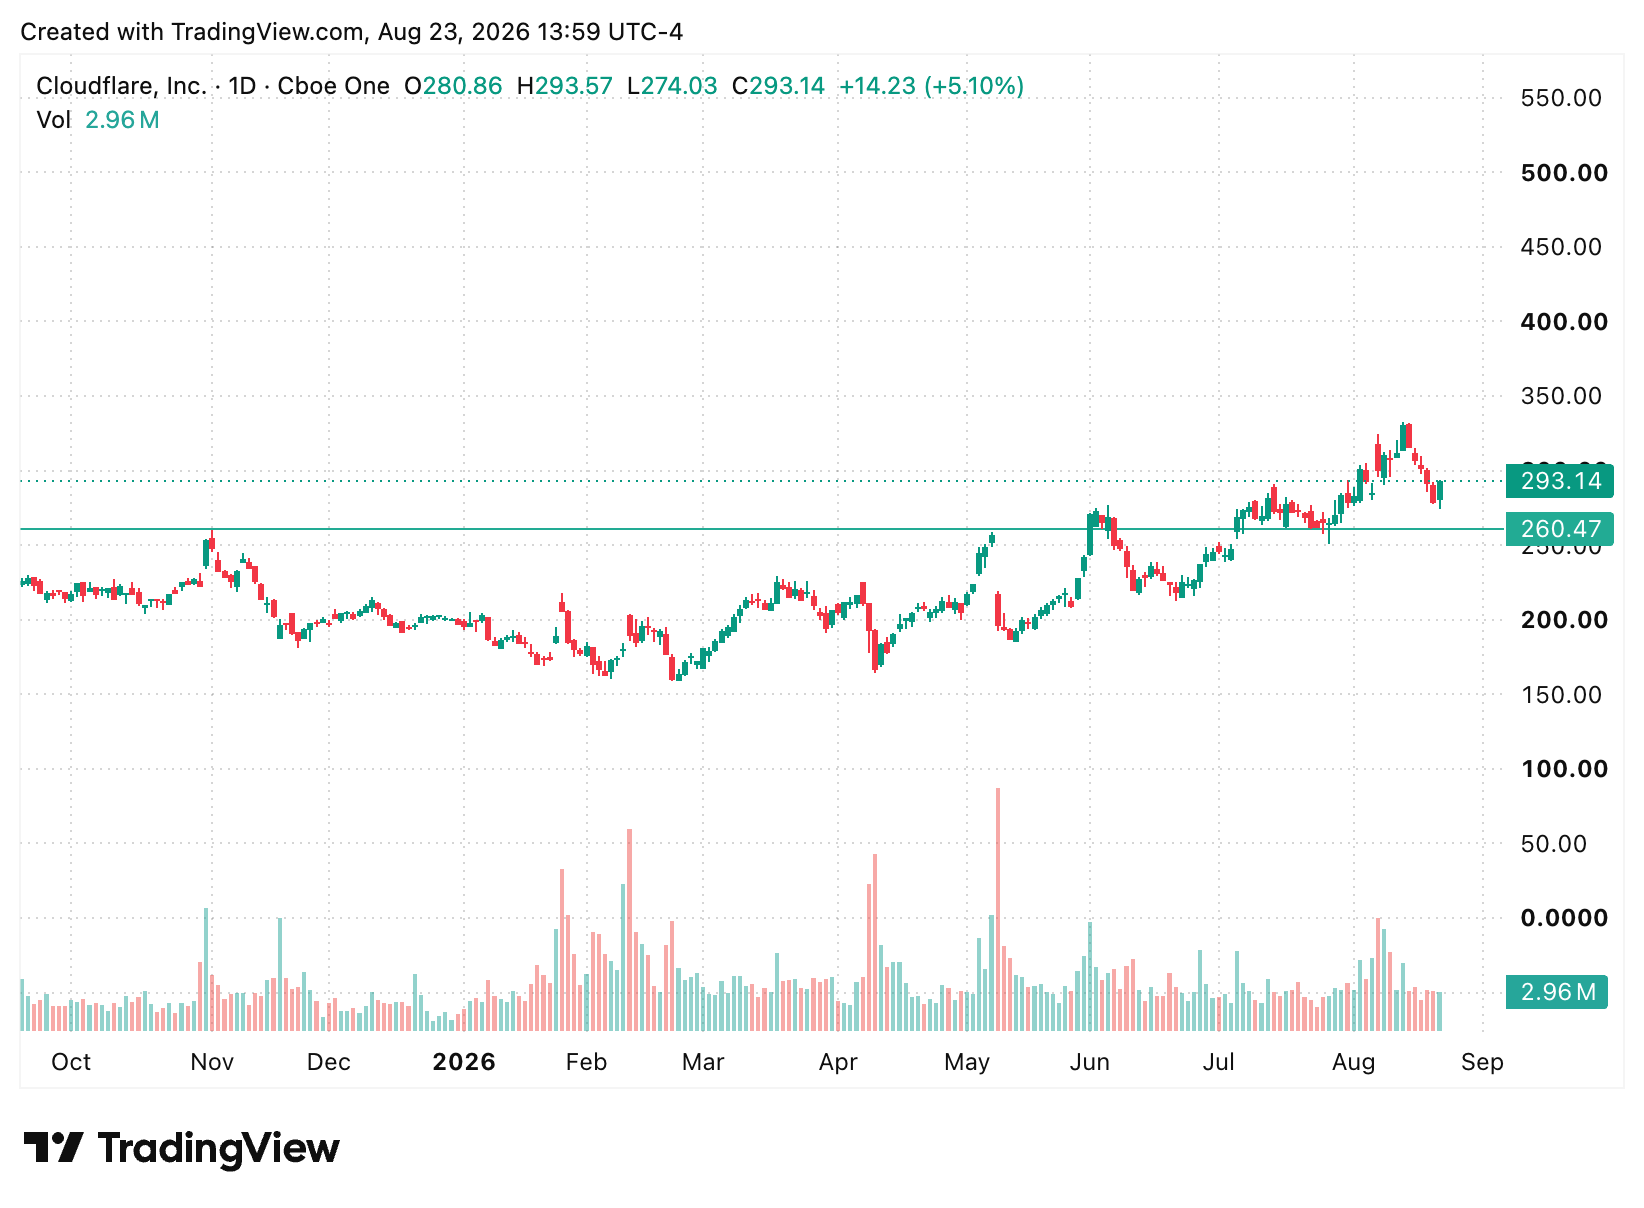
These charts do not prove that networking-related stocks will outperform semiconductors. They show that the market is already rewarding parts of the infrastructure path that connect AI factories to customers.
AI Platforms: Value Moves Up the Stack
As AI infrastructure gets built out, the next layer of value creation may belong to the platforms that turn compute into products used by consumers, developers and businesses.
META 0.00%↑ is becoming more than a consumer-app company. Its Family of Apps averaged 3.60 billion daily active people in June, giving it a distribution advantage few AI companies can match.
Its open-weight model strategy adds a developer ecosystem, while Meta Business Agent is turning WhatsApp, Messenger and Instagram into an enterprise-software surface.
This creates a vertically integrated AI platform: Meta controls the infrastructure, develops models, distributes products to billions of people and increasingly gives businesses tools to build and deploy AI agents.
The investment question is whether the market will begin rewarding AI platforms as much as, or more than, the infrastructure layer as the AI trade matures.
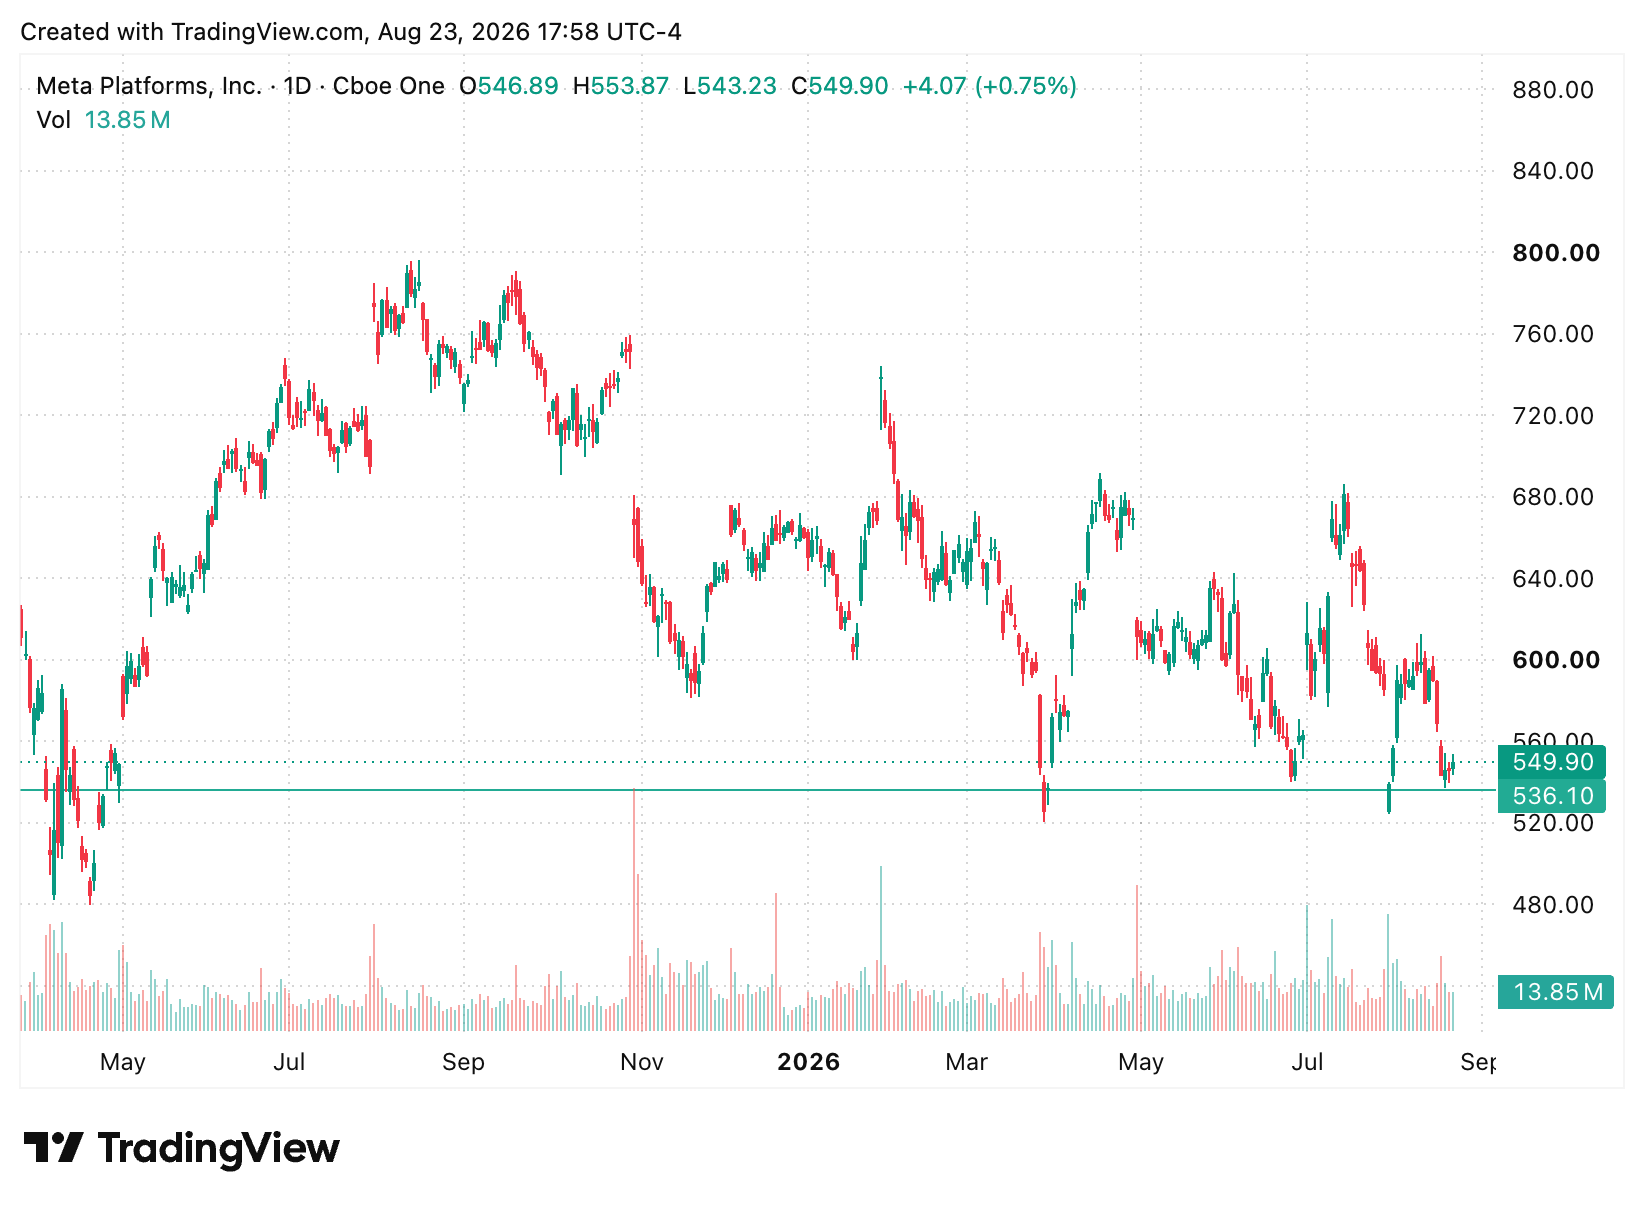
Technically, META is testing support near 536. Holding that level would keep the rebound setup alive; a decisive break below it would invalidate the setup.
What would healthy broadening look like?
The bullish version is straightforward. Gold and Bitcoin hold their breakout levels. Biotech remains above its relative-strength ceiling. Software clears 108. Semiconductors break upward from their triangle.
That would show capital moving into new opportunities without abandoning the companies that have already produced strong earnings. The market would be broadening.
The warning case would look different. Bitcoin and biotech continue accelerating while software fails at resistance and semiconductors break below support. In that environment, investors would be paying increasingly high prices for momentum while rejecting companies with visible earnings. That would not prove that a market top has arrived. It would say that the quality of the rally is weakening.
The week ahead
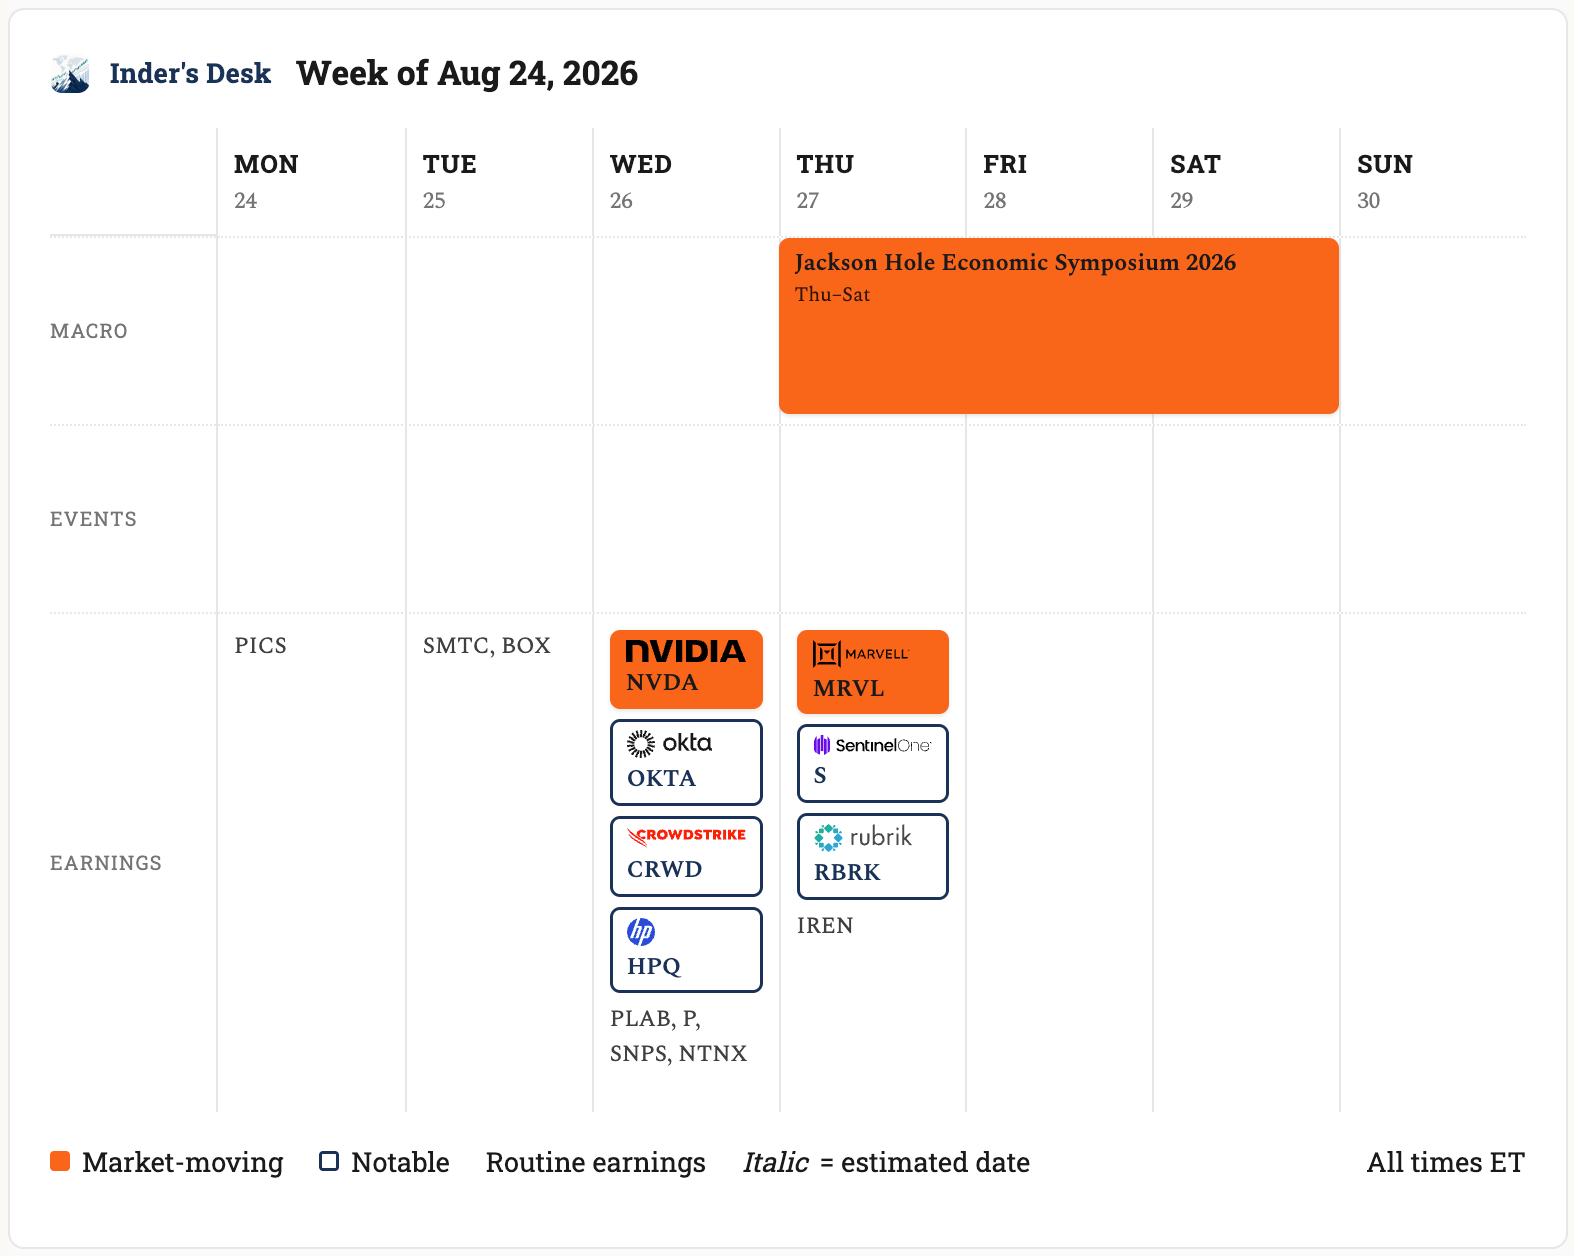
Three events dominate the week ahead. Nvidia reports Wednesday afternoon, Marvell follows Thursday, and the Jackson Hole Economic Policy Symposium runs from Thursday through Saturday. The market will be listening closely for signals about inflation, interest rates and the direction of monetary policy.
With Treasury yields, the dollar, gold and Bitcoin already moving sharply, investors are waiting to decide whether Jackson Hole confirms the recent shift or challenges it. The numbers from Nvidia and Marvell matter, but the market’s interpretation of all three events will matter more.
In Closing
The market is not saying that the AI infrastructure trade is finished. It is asking whether the old leaders can regain their footing or whether the next phase of the AI trade is moving up the stack.
That makes next week’s job simple: watch where the market assigns leadership, not just how it reacts to the headlines.
See More From Inder’s Desk


Disclaimer:
This article is for informational and educational purposes only and does not constitute financial, investment, tax, or legal advice. Any opinions, scenarios, price targets, or market observations reflect my personal views and may change without notice. Investing and trading involve substantial risk, including the possible loss of principal. You are solely responsible for your own investment decisions, position sizing, risk management, and trades. Conduct your own research and consult a qualified professional where appropriate.


